Posted on 01/12/2022 11:50:14 AM PST by blam
Today, I heard two local, small town radio DJs going on about rate hikes coming down the pike, and I thought wow here we are again with rate-hike-hysteria.
Eight years ago I posted an article, Interest Rates Cannot Rise, Here’s Why In that article I depicted my model, forecasting that interest rates would not and could not rise.
Now remember 2014 was the peak messaging period by the Fed and Wall Street gearing up for “rate normalization”. So to go on record stating that rate normalization was impossible, was a risky move. In fact, a friend, who is a friend of Tom Campbell, who at the time was the Dean of Berkeley’s Haas Business School, described a conversation the two of them had about my theory. In that conversation Tom had me pegged as a “half-baked-monkey”. And fair enough, because at the time “rate normalization” had become a household phrase. It was simply, a given.
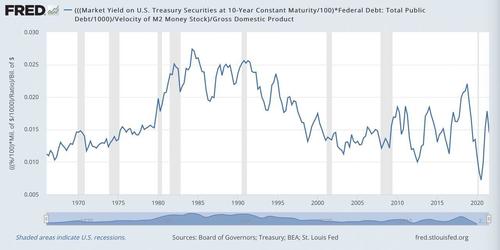
But the model I built was simple and took debt service as a percent of GDP over history and found a fairly tight range, (2%, 5%). Debt service is a drag on economic output and is a function of interest rates and debt. Given the deteriorating independent parameters of debt and GDP, the 10 year rate (proxy for average rate on public debt) was rigidly constrained, at least if history was a guide. Here’s the model.
The blue line above represents the predictive model and it predicted that the 10 year could not possibly break 4%. It is now 8 years on and we know that the 10 year peaked in 2018, at around 3.25%. History proved smarter than the experts.
Fast forward to today and here we go again. I figured it was time to dust off the model and give it another look. The one issue I always had with the model in its original form was that it wasn’t dynamic enough. That is, it didn’t adjust for the deteriorating economic productivity, which reduces capacity for economic drag (i.e. interest rates). It means the model lacked a key gauge for drag or interest rate capacity.
Think of it in terms of towing a trailer. Imagine two trucks both hauling 6,000 lbs (i.e. drag) at 60 mph (i.e. output). From the outside they look the same. However, from inside the cockpits we see that one truck is running at 2,000 RPMs and the other is running at 7,000 RPMs. That is, one has additional drag capacity, whereas the other is at full capacity and burning much more fuel. The drag on both trucks is the same (6,000 lbs) and the output is the same (60 mph) but the truck at 2,000 RPMs has additional drag capacity meaning it could take on more weight while maintaining 60 mph output (it would simply increase RPMs). The truck at 7,000 RPMs is at max RPMs and could not take on additional drag without reducing output i.e. speed. Its drivetrain simply does not have the productivity for additional drag without giving up output.
In our economy interest rates are drag and GDP is output and those were covered in my original model. But I needed to improve the model to adjust for drag capacity i.e. drivetrain productivity. Here’s where I landed.
Money velocity is, in effect, the productivity of the economic drivetrain. It is a gauge of how efficiently or productively each dollar is used to generate output. It’s similar to RPMs in the above metaphor albeit in the inverse. The higher the velocity, the more capacity for additional drag given a fixed level of output. And so I updated my model by inserting M2 Velocity. Here’s what we get.
I take the the 10 year rate as a proxy for average rate on public debt multiplied by total public debt to give us our debt service. That’s our drag. But this needs to be adjusted by a factor of productivity to give us an “adjusted debt service”, and to do that I use M2 Velocity. Now we have our adjusted debt service over GDP.
What we find is an even tighter historic range than we had in the original model. The updated model range is (.9%, 2.74%) of GDP. That is an extremely tight range over a 60 year period with underlying parameters that have significant variance over time. Now we can solve algebraically for a max 10-year rate given various inputs of debt, GDP, and velocity.
Ok so what does all this mean?
In a nutshell, the 10-year rate cannot break 2.5%.
At 2.5% our adjusted debt service to GDP moves to 2.74%, matching the all time high in 1985. At that time, the economy had a very high capacity for drag and managed 13% rates due to a very productive drivetrain (low public debt and high velocity). Today we have the drivetrain of an ’83 Yugo with no drag capacity at all. In fact, today, in real terms, our economy is being pushed by negative drag. Even small adjustments to that negative drag will have enormous impacts on output.
In short, the Fed has no tools to add drag without a catastrophic reduction in output. And so inflation is a freight train hurling down an endless abyss with no brakes. Sir Hayek, was right.
Your thoughts on interest rates today/tomorrow?
Interest rates can and will go up. It will cause the U.S. budget deficits to surge and the economy to crater, but the democrats are already treating it as monopoly money. A few trillion here, a few trillion there, what’s the difference?
And so inflation is a freight train hurling down an endless abyss with no brakes.
So, what will inflate excessively and what might be fairly stable?
I don't believe that will happen.
I’m going to invest in wheelbarrows. People will need to bring their cash to the supermarket somehow.
World banks and governments painted themselves into a financial corner.
Artificial low rates that a whole generation thinks is normal and deficit spending in the macro and micro economic sense
Sooner or later the piper will be paid! And it will be ugly.
As long as no one reins in the spending, inflation is the easiest way to spread the pain out in the widest path.
MV = PQ
where M = money supply (he uses M2 here)
V = velocity of money (the number of times M passes through the system in a period of time)
P = Price Level
Q = real output
In the author's model, he assumes P is constant. As we all know right now, P is increasing at almost 7%. If prices are stable, the year-to-year change in Q is the productivity of the economic system. That productivity rate should be equal to the real rate of interest. To keep things in balance, the monetary interest rate--the rate charged by the Fed to member banks--is equal to the real rate of interest plus the rate of inflation. The last figures I saw had productivity falling year-over-year, which puts less pressure on interest rates right now. However, if output starts to grow, and I think it will, there will be upward pressure on interest rates as businesses clamor for funds to expand production ahead of sales.
In sum, I wouldn't bet any money on his theory that interest rates cannot rise.
As long as the Fed keeps printing money and under-bidding the professionals for U.S. Treasury debt, interest rates are going no where.
Why the stock market is going to keep going up up and up.
I do predict a steep correction this year but that is good.
Where else you going to put your money? .025 bank? .050 cd?
Interest Rates ARE a drag on the Economy. That is why the FED raises them. And, yes, it’s PAINFUL!
Either the Fed will start gradually raising the Fed Funds rate this quarter, or we will end up with Jimmy Carter stagflation. To kill the last round of hyperinflation in the early 1980s, the Fed ended up increasing the Fed Funds rate all the way to 18%.
I’ve said to young people for many years that people don’t buy a price. They buy a monthly payment. It means the time to buy a house - from an investment perspective at least - is when interest rates are really high. It will depress prices and you can refi when rated come down. If you buy when rates are low, you are buying at a “peak” price and you’ll never be able to re-finance.
It looks like rates are about to climb. This means prices are going to fall, yet again. And this may be even bigger than the 2008 thing. We could see city markets drop by 50% or more. And because tech is enabling more and more WFH, it means it may “never” come back because when people walk away (like happened last time) they may walk away to more rural areas and STAY there.
Interest on the debt in 2022 is projected to be $305 billion. That is 5% of the Federal Government's budget. And 1.5% of GDP, if GDP is 20,054 billion. (a 2018 number for GDP).
tl;dr.
Do you wanna know the real reason why interest rates aren’t rising? Simple. FedGov has found they can keep borrowing billions and trillions of dollars at low interest rates and save billions of trillions of dollars in interest.
The only problem with that is FedGov has no plan whatsoever to pay back the interest much less the principle.
At that time, the economy had a very high capacity for drag and managed 13% rates due to a very productive drivetrain (low public debt and high velocity). Today we have the drivetrain of an ’83 Yugo with no drag capacity at all.
—
An economic Yugo. Great.
Communists are always creating policies to collapse an economy because the only way a revolution is possible to bring them to power is when things are horrible and people desperate. Bolsheviks did not take power in Russia because things were great, same everywhere else. Communists and socialists were rising in the 1930s in America because of the great depression and got put on hold due to WWII. Communists (aka Demoncrats) are happy to crash the economy and are actively doing so with the expectation of if successfully they will seize permanent control.
A borrower should be able to afford to pay 5% to 7% or so to rent somebody else's money.
In the past, those who saved for their retirement could count on converting to less risky CDs, etc., and living off the interest, drawing down little if any of their principal.
A lot of folks are holding off retiring, or otherwise dealing with low income, fearing out-living their money.
If interest rates rose to the point where they would be able to draw an income form the interest, it would free up a lot of money that's now in their savings.
The banks and other lending institutions could make their 1% or 2% spread on a LOT more money.
Fed’s Beige Book Sees Continued Easing Of Shortages, But Warns Of Omicron-Linked Slowdowns
Does easing of shortages equal reduced inflation?
Disclaimer: Opinions posted on Free Republic are those of the individual posters and do not necessarily represent the opinion of Free Republic or its management. All materials posted herein are protected by copyright law and the exemption for fair use of copyrighted works.