Posted on 03/03/2025 7:34:58 PM PST by SeekAndFind
For some time, monthly consumer retail spending reports from the Census Bureau have had a touch of amazement about them. Many would strong economic growth would be spread close to evenly across each wealth class.
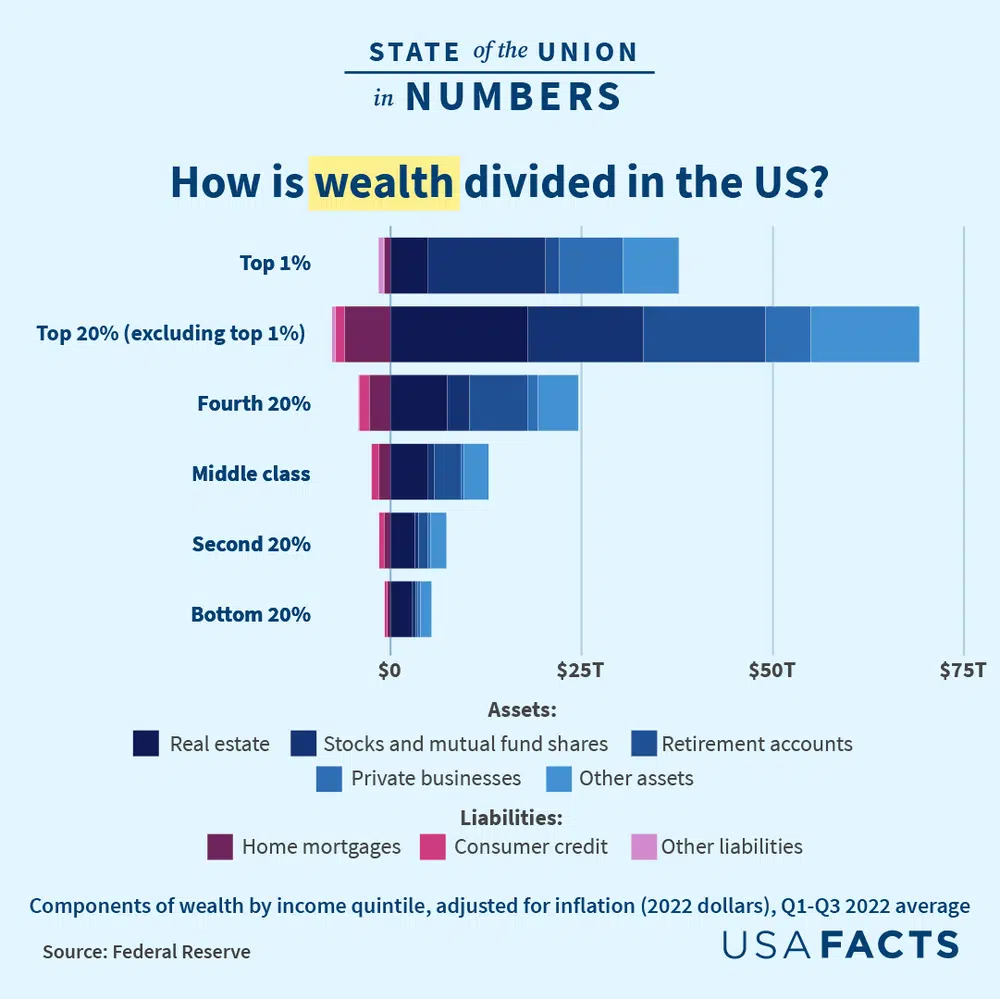
However, according to a Moody’s Analytics analysis of Federal Reserve data, the bustling economy is not a story of all consumers spending shoulder-to-shoulder. Instead, according to The Wall Street Journal on Moody's numbers, the tale is of how statistical distributions are always critical in looking at data.
The top 10% of earners — households making $250,000 a year or more — are responsible for 49.7% of all consumer spending. Thirty years ago, the amount was about 36%.
In a U.S. economy where such activity is responsible for roughly 69% of gross domestic product that is a big deal. A tenth of households drive 34.3% of GDP by themselves.
“When you look at the dynamics, I think there certainly is evidence to support that,” Michael Brown, principal U.S. economist at Visa, told Marketplace.
The Journal said that according to Moody’s, the highest earners increased their spending by 12% between September 2023 and September 2024, the latter being the most recent data available. Simultaneously, spending by working-class and middle-class consumers dropped over the same range.
Over the last four years, prices rose by 21%. The top 10% of households increased their spending by 58%. The bottom 80% spent 25% more than four years ago.
“The finances of the well-to-do have never been better, their spending never stronger and the economy never more dependent on that group,” Zandi told the Journal.
Inflation has hit lower-income households — which relatively speaking seems to be almost all of them — the hardest. It was one of the largest issues voters had in the run-up to the presidential election last year.
An examination of data from the Federal Reserve Bank of Atlanta and curated by the Federal Reserve Bank of St. Louis, median household real income has seen annual increases of something under 2%. The 25th percentile of the population has hovered over the last few years at losing from 5% to 10% of their incomes annually. The top 75% had been seeing rises between roughly 10% and 13%. The spread of economic power increases quickly and to extreme degrees.
The danger is that the spending of the wealthiest could be buoyed by the values of their stock portfolios. But that makes the economy more vulnerable should there be a shakeout.
“I mean if their spending is being driven by record stock prices, I wouldn’t count on that for sustaining long-term economic growth,” Moody's chief economist Mark Zandi said to Marketplace.
No? I’m no genius, but this seems a tad obvious.
I’ve said repeatedly that a graduated consumption tax is fairer and makes more sense than an income tax because the less well-heeled can’t reduce their income tax indebtedness by any means other than earning less, which makes them all the poorer, income tax or no.
And there’s not much point being rich if you don’t buy lots of rich stuff, so tax the hell out of luxury items and stop taxing essentials and the cheap stuff the bottom class folks have lots of need for.
I’m peddling as fast as I can!
Reported that OPEC jumped its production today.
We shall see.
Yeah, BS. The manufacturing sector is the proven influencer of the economy. With lower priced energy (oil/gas) the economy will recover just fine. PDJT is pushing hard for all of that.
Welp, my house and car and truck are paid for, I have no big bill.
I guess you gamblers and debtors will have to carry this one.
Good luck
“I mean if their spending is being driven by record stock prices, I wouldn’t count on that for sustaining long-term economic growth,” Moody’s chief economist Mark Zandi said to Marketplace.
I have never paid for anything with a share of stock. This goober is the best Moody can find?
A household making $250k probably only has stock invested in their 401k. They don’t have a massive stock portfolio to take to the grocery store or mortgage office.
EC
Explain how spending on IMPORTED goods helps the US economy?
Then the bottom 90% surely must recommit themselves to making that top 10% richer and richer. Trickle down, as the Dems like to say.
The article defines the top 10% of "wealthiest" as households earning $250,000 per year, but many households are living paycheck to paycheck. They may be "house rich and cash poor." They don't have the discretionary income to spend the way the article suggests they would.
When we look at wealth as net worth, the "wealthiest" 10% as of 2023 have a net worth of $1,920,758.
| Percentile | 2023 | 2020 | Difference | Change |
|---|---|---|---|---|
| 1% | -$76,472.00 | -$109,563.55 | $33,092 | |
| 2% | -$45,428.00 | -$63,602.13 | $18,174 | |
| 3% | -$26,450.00 | -$41,423.80 | $14,974 | |
| 4% | -$14,983.00 | -$30,065.29 | $15,082 | |
| 5% | -$9,878.00 | -$21,313.72 | $11,436 | |
| 6% | -$4,381.00 | -$13,824.69 | $9,444 | |
| 7% | -$831.80 | -$8,658.63 | $7,827 | |
| 8% | $1.00 | -$4,446.27 | $4,447 | |
| 9% | $182.20 | -$2,124.09 | $2,306 | |
| 10% | $440.20 | -$540.86 | $981 | |
| 11% | $990.20 | $3.98 | $986 | 24804.08% |
| 12% | $2,552.00 | $206.57 | $2,345 | 1135.42% |
| 13% | $4,056.00 | $582.43 | $3,474 | 596.39% |
| 14% | $5,208.00 | $997.98 | $4,210 | 421.85% |
| 15% | $6,532.20 | $1,828.28 | $4,704 | 257.29% |
| 16% | $7,726.00 | $3,005.57 | $4,720 | 157.06% |
| 17% | $9,256.00 | $4,001.60 | $5,254 | 131.31% |
| 18% | $10,370.40 | $5,193.71 | $5,177 | 99.67% |
| 19% | $11,810.00 | $6,234.61 | $5,575 | 89.43% |
| 20% | $13,528.00 | $7,382.19 | $6,146 | 83.25% |
| 21% | $15,600.20 | $8,535.73 | $7,064 | 82.76% |
| 22% | $18,022.20 | $9,866.87 | $8,155 | 82.65% |
| 23% | $20,716.00 | $11,231.67 | $9,484 | 84.44% |
| 24% | $23,310.00 | $12,493.09 | $10,817 | 86.58% |
| 25% | $27,016.00 | $14,408.98 | $12,607 | 87.49% |
| 26% | $30,316.20 | $16,458.08 | $13,858 | 84.20% |
| 27% | $34,242.00 | $18,617.90 | $15,624 | 83.92% |
| 28% | $39,436.00 | $20,989.19 | $18,447 | 87.89% |
| 29% | $44,734.00 | $23,579.15 | $21,155 | 89.72% |
| 30% | $51,366.00 | $27,467.96 | $23,898 | 87.00% |
| 31% | $57,040.00 | $31,588.28 | $25,452 | 80.57% |
| 32% | $62,600.20 | $35,928.65 | $26,672 | 74.23% |
| 33% | $67,500.00 | $42,175.13 | $25,325 | 60.05% |
| 34% | $73,120.20 | $47,082.79 | $26,037 | 55.30% |
| 35% | $79,054.00 | $52,258.85 | $26,795 | 51.27% |
| 36% | $84,256.00 | $58,434.33 | $25,822 | 44.19% |
| 37% | $89,534.00 | $64,229.63 | $25,304 | 39.40% |
| 38% | $96,524.00 | $69,023.35 | $27,501 | 39.84% |
| 39% | $101,964.00 | $73,150.04 | $28,814 | 39.39% |
| 40% | $110,314.00 | $78,210.15 | $32,104 | 41.05% |
| 41% | $117,810.00 | $83,233.43 | $34,577 | 41.54% |
| 42% | $125,686.00 | $87,868.97 | $37,817 | 43.04% |
| 43% | $132,632.00 | $93,207.42 | $39,425 | 42.30% |
| 44% | $141,164.00 | $97,845.99 | $43,318 | 44.27% |
| 45% | $147,316.00 | $103,804.45 | $43,512 | 41.92% |
| 46% | $155,908.00 | $110,104.53 | $45,803 | 41.60% |
| 47% | $164,132.00 | $116,603.53 | $47,528 | 40.76% |
| 48% | $172,168.00 | $123,264.12 | $48,904 | 39.67% |
| 49% | $181,562.00 | $132,374.65 | $49,187 | 37.16% |
| 50% | $192,084.00 | $140,740.06 | $51,344 | 36.48% |
| 51% | $202,106.20 | $147,735.90 | $54,370 | 36.80% |
| 52% | $212,562.00 | $155,573.60 | $56,988 | 36.63% |
| 53% | $223,554.00 | $164,167.82 | $59,386 | 36.17% |
| 54% | $238,034.00 | $173,913.48 | $64,121 | 36.87% |
| 55% | $250,380.00 | $183,652.59 | $66,727 | 36.33% |
| 56% | $261,644.00 | $194,130.85 | $67,513 | 34.78% |
| 57% | $274,944.00 | $202,794.81 | $72,149 | 35.58% |
| 58% | $288,614.00 | $211,090.39 | $77,524 | 36.73% |
| 59% | $298,884.00 | $222,484.91 | $76,399 | 34.34% |
| 60% | $312,622.00 | $233,360.13 | $79,262 | 33.97% |
| 61% | $327,622.00 | $244,703.29 | $82,919 | 33.89% |
| 62% | $347,520.00 | $254,335.13 | $93,185 | 36.64% |
| 63% | 366,448.00 | 264,950.46 | $101,498 | 38.31% |
| 64% | 384,910.00 | 276,252.96 | $108,657 | 39.33% |
| 65% | 402,800.00 | 288,800.11 | $114,000 | 39.47% |
| 66% | 415,460.00 | 301,562.41 | $113,898 | 37.77% |
| 67% | 429,190.00 | 315,157.59 | $114,032 | 36.18% |
| 68% | 447,958.00 | 334,427.04 | $113,531 | 33.95% |
| 69% | 468,284.20 | 350,078.23 | $118,206 | 33.77% |
| 70% | 493,068.00 | 365,055.97 | $128,012 | 35.07% |
| 71% | 521,000.20 | 380,933.26 | $140,067 | 36.77% |
| 72% | 551,988.00 | 404,981.00 | $147,007 | 36.30% |
| 73% | 587,968.00 | 424,173.51 | $163,794 | 38.61% |
| 74% | 622,546.00 | 443,871.17 | $178,675 | 40.25% |
| 75% | 658,340.00 | 467,486.30 | $190,854 | 40.83% |
| 76% | 697,576.00 | 496,859.82 | $200,716 | 40.40% |
| 77% | 743,564.00 | 528,143.96 | $215,420 | 40.79% |
| 78% | 785,484.00 | 562,417.04 | $223,067 | 39.66% |
| 79% | 836,944.00 | 607,334.44 | $229,610 | 37.81% |
| 80% | 891,750.00 | 647,053.48 | $244,697 | 37.82% |
| 81% | 947,453.00 | 685,494.02 | $261,959 | 38.21% |
| 82% | 1,009,860.00 | 738,468.50 | $271,392 | 36.75% |
| 83% | 1,078,294.00 | 790,322.17 | $287,972 | 36.44% |
| 84% | 1,154,634.00 | 854,472.96 | $300,161 | 35.13% |
| 85% | 1,234,848.00 | 921,817.69 | $313,030 | 33.96% |
| 86% | 1,308,426.00 | 991,010.22 | $317,416 | 32.03% |
| 87% | 1,399,334.00 | 1,076,509.41 | $322,825 | 29.99% |
| 88% | 1,510,942.00 | 1,148,986.00 | $361,956 | 31.50% |
| 89% | 1,693,542.00 | 1,258,856.33 | $434,686 | 34.53% |
| 90% | 1,920,758.00 | 1,413,211.39 | $507,547 | 35.91% |
| 91% | 2,157,988.00 | 1,571,026.97 | $586,961 | 37.36% |
| 92% | 2,382,960.00 | 1,787,377.41 | $595,583 | 33.32% |
| 93% | 2,692,160.00 | 2,048,897.78 | $643,262 | 31.40% |
| 94% | 3,088,722.00 | 2,411,796.58 | $676,925 | 28.07% |
| 95% | 3,779,600.00 | 2,995,523.80 | $784,076 | 26.17% |
| 96% | 4,699,180.20 | 3,818,855.14 | $880,325 | 23.05% |
| 97% | 6,150,980.00 | 5,379,387.17 | $771,593 | 14.34% |
| 98% | 8,464,740.20 | 7,600,900.82 | $863,839 | 11.36% |
| 99% | 13,666,778.00 | 12,866,153.31 | $800,625 | 6.22% |
I can see a household with a net worth of $2 million spending more than a household with a gross income of $250,000.
-PJ
I saw a Yahoo article that says we may suffer a 0.2% drop in GDP - where Canada, if it retaliates, will likely suffer a 3.0% decrease - funny about how all those that used to tell us there was no danger of a recession are now becoming town criers about it...
Who runs Globest.com?
The US is increasingly dependent on the TAXES of the top 10%. That is the real problem. The top 10% of US taxpayers pay 76% of all taxes.
Disclaimer: Opinions posted on Free Republic are those of the individual posters and do not necessarily represent the opinion of Free Republic or its management. All materials posted herein are protected by copyright law and the exemption for fair use of copyrighted works.