 Bureau of Labor Statistics
 Posted on 01/07/2015 8:38:44 AM PST by Theoria
Many economists say no—but they may be too glib.
The job news is increasingly good: 321,000 jobs created in November. Yet the national economic mood remains grimly bleak.
Many Americans feel a sharp distinction between what’s said about “the” economy and what they experience in “their” economy. At the top of the income distribution, wages are rising. In the middle and bottom, wages stagnate. Jobs are created, yes—but native-born Americans are not hired for them.
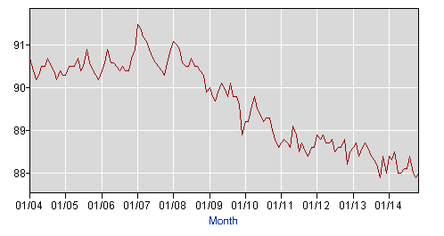
Last month, the Center for Immigration Studies released its latest jobs study. CIS, a research organization that tends to favor tight immigration policies, found that even now, almost seven years after the collapse of Lehman Brothers, 1.5 million fewer native-born Americans are working than in November 2007, the peak of the prior economic cycle. Balancing the 1.5 million fewer native-born Americans at work, there are 2 million more immigrants—legal and illegal—working in the United States today than in November 2007. All the net new jobs created since November 2007 have gone to immigrants. Meanwhile, millions of native-born Americans, especially men, have abandoned the job market altogether. The percentage of men aged 25 to 54 who are working or looking for work has dropped to the lowest point in recorded history.
Labor Force Participation Rate Among Men Aged 25 to 54, 2004-2014
Bureau of Labor Statistics (Excerpt) Read more at theatlantic.com ...
The last statistic I read was that there were 92 million Americans who were not in the labor force, and that the jobs are going to immigrants and illegals. I don’t see how someone can state that this doesn’t harm working Americans, unless it is a parsing of words. If someone is working, then immigrants aren’t hurting that person’s employment. Otherwise, let’s deport all persons who are in this country illegally and see what happens to the employment rate and job participation.
I now have a non-native delivering my mail who speaks broken English and misdelivers mail constantly, tell me again about how they can’t get Americans to do the jobs?
We’ve all known that for years. Ain’t no democracy anymore just crony capitalism.
Illegal immigration suppresses wages.
Here's my answer to David Frum:


Federal court upholds U.S. flag ban on Cinco de Mayo; lawyer vows to take case to U.S. Supreme Court
Yes, next question.
He says their arguments might sound logical and meritorious, but what they use to justify all the immigration isn’t what happens. So yeah, it does harm Americans.
” Yes, next question.”
Not a tough call.

If there is one thing we can blame for the destruction of America it is the change from a constitutional republic to a democracy.
Democracy is nothing but a satanic agenda to make people think they are ruling them selves when the constitutional republic was the actual machine that allowed the people to rule.
Native-born Americans are not in the democrats play book they need the stupid and hungry to keep them in power until full socialism in enacted.
Obama has gained more ground in six years then his party has in fifty years Ted Kennedy expected to come back to life soon.
Most are either unaware or in denial.
This idea that any main party cares about immigration enforcement has always been a chuckle.
Agree it’s not going to get any better soon they have to feel the wrath of the people.
Something else that nobody is talking about, nobody at all. If white fifty-year-old electrical engineers with spotless records are not finding jobs, just think how black unskilled youth must be feeling, especially with so many of their cohorts whispering in their ears about people not hiring them because RACISM. This group is suffering under staggering unemployment numbers and chatter you are going to ignore if things are going well for you is going to take on all new relevance when you are stuck and start looking for an explanation for what is happening to you.
At some level someone knows this and is very cynically blaming it on ANYTHING but unchecked immigration (legal and illegal).
It destroys wages.
There is no fare market wage when foreigners are imported by the millions, to make sure that wages stay low.
What is a survival job today, used to be a solid job that could support a family.
Immigration suppresses wages, the only difference between legal and illegal is how quickly they get to vote for the democrats and collect welfare.
Getting ready for Obama's State of the Union lies.
I have attempted to
|
See below for table information.
Column headings
N = not available.Some columns are omitted to fit desired columns on a PC screen. The additional columns are explained below.
| Year | 4. | 6. | 7. | 13. |
|---|---|---|---|---|
| 1948 | 58.8 | 56.6 | N | N |
| 1949 | 59.4 | 55.3 | N | N |
| 1950 | 59.2 | 56.8 | N | N |
| 1951 | 59.4 | 57.4 | N | N |
| 1952 | 59.0 | 57.3 | N | N |
| 1953 | 58.5 | 56.3 | N | N |
| 1954 | 58.5 | 55.4 | N | N |
| 1955 | 60.0 | 57.5 | N | N |
| 1956 | 59.8 | 57.3 | N | N |
| 1957 | 59.5 | 56.6 | N | N |
| 1958 | 59.3 | 55.6 | N | N |
| 1959 | 59.3 | 56.0 | N | N |
| 1960 | 59.6 | 55.9 | N | N |
| 1961 | 59.0 | 55.3 | N | N |
| 1962 | 58.6 | 55.3 | N | N |
| 1963 | 58.7 | 55.4 | N | N |
| 1964 | 58.5 | 55.6 | N | N |
| 1965 | 58.9 | 56.5 | N | N |
| 1966 | 59.5 | 57.3 | N | N |
| 1967 | 59.9 | 57.5 | N | N |
| 1968 | 59.6 | 57.6 | 65503 | N |
| 1969 | 60.3 | 58.1 | 66929 | N |
| 1970 | 60.4 | 56.9 | 66654 | N |
| 1971 | 60.3 | 56.7 | 67622 | N |
| 1972 | 60.4 | 57.2 | 70115 | N |
| 1973 | 61.1 | 58.2 | 72560 | N |
| 1974 | 61.3 | 57.2 | 72825 | N |
| 1975 | 61.1 | 56.0 | 72269 | 60028 |
| 1976 | 61.8 | 57.0 | 74532 | 60120 |
| 1977 | 62.6 | 58.5 | 77922 | 59846 |
| 1978 | 63.5 | 59.7 | 81416 | 59541 |
| 1979 | 63.8 | 60.0 | 83345 | 60131 |
| 1980 | 63.7 | 59.0 | 82648 | 61252 |
| 1981 | 63.8 | 58.5 | 82799 | 61933 |
| 1982 | 64.1 | 57.3 | 80606 | 62087 |
| 1983 | 64.1 | 58.6 | 83997 | 62790 |
| 1984 | 64.5 | 59.8 | 87458 | 62876 |
| 1985 | 64.9 | 60.4 | 89259 | 62730 |
| 1986 | 65.4 | 60.9 | 91297 | 62778 |
| 1987 | 65.7 | 61.9 | 93914 | 62874 |
| 1988 | 66.1 | 62.6 | 95927 | 62765 |
| 1989 | 66.5 | 63.0 | 98015 | 62570 |
| 1990 | 66.4 | 62.3 | 98285 | 63797 |
| 1991 | 66.1 | 61.4 | 96973 | 64982 |
| 1992 | 66.3 | 61.4 | 97949 | 65276 |
| 1993 | 66.3 | 61.9 | 99952 | 65879 |
| 1994 | 66.7 | 63.0 | 101003 | 65739 |
| 1995 | 66.5 | 62.8 | 102217 | 66738 |
| 1996 | 67.0 | 63.5 | 104753 | 66444 |
| 1997 | 67.1 | 64.0 | 107293 | 67019 |
| 1998 | 67.2 | 64.2 | 109129 | 67666 |
| 1999 | 67.1 | 64.4 | 111415 | 68669 |
| 2000 | 66.9 | 64.3 | 114163 | 70616 |
| 2001 | 66.7 | 63.0 | 112610 | 71901 |
| 2002 | 66.4 | 62.5 | 112942 | 73403 |
| 2003 | 66.1 | 62.2 | 113947 | 75461 |
| 2004 | 66.0 | 62.4 | 115204 | 76413 |
| 2005 | 66.0 | 62.8 | 117753 | 77164 |
| 2006 | 66.3 | 63.3 | 120658 | 77503 |
| 2007 | 66.0 | 62.8 | 121621 | 79291 |
| 2008 | 65.9 | 61.4 | 118281 | 80102 |
| 2009 | 64.9 | 58.4 | 110906 | 83148 |
| 2010 | 64.4 | 58.3 | 111653 | 84913 |
| 2011 | 64.0 | 58.5 | 113268 | 86452 |
| 2012 | 63.7 | 58.7 | 115616 | 88745 |
| 2013 | 62.8 | 58.5 | 116845 | 91616 |
| 2014 | 62.8(III) | 59.0(III) | 118797(III) | 92285(III) |
| pop. |
|---|
| 146630 |
| 149190 |
| 152270 |
| 154880 |
| 157550 |
| 160180 |
| 163030 |
| 165930 |
| 168900 |
| 171980 |
| 174880 |
| 177830 |
| 180670 |
| 183690 |
| 186540 |
| 189240 |
| 191890 |
| 194300 |
| 196560 |
| 198710 |
| 200710 |
| 202680 |
| 205050 |
| 207660 |
| 209900 |
| 211910 |
| 213850 |
| 215970 |
| 218040 |
| 220240 |
| 222580 |
| 225060 |
| 227220 |
| 229470 |
| 231660 |
| 233790 |
| 235820 |
| 237920 |
| 240130 |
| 242290 |
| 244500 |
| 246820 |
| 249620 |
| 252980 |
| 256510 |
| 259920 |
| 263130 |
| 266280 |
| 269390 |
| 272650 |
| 275850 |
| 279040 |
| 282160 |
| 284970 |
| 287630 |
| 290110 |
| 292810 |
| 295520 |
| 298380 |
| 301230 |
| 304090 |
| 306770 |
| 309330 |
| 311590 |
| 313910 |
| 316160 |
| 319470 |
| one* | two** | three*** |
|---|---|---|
| N | N | N |
| N | N | N |
| N | N | N |
| N | N | N |
| N | N | N |
| N | N | N |
| N | N | N |
| N | N | N |
| N | N | N |
| N | N | N |
| N | N | N |
| N | N | N |
| N | N | N |
| N | N | N |
| N | N | N |
| N | N | N |
| N | N | N |
| N | N | N |
| N | N | N |
| N | N | 43,558 |
| N | N | 45,435 |
| N | N | 47,124 |
| N | N | 46,759 |
| N | N | 46,304 |
| N | N | 48,287 |
| N | N | 49,262 |
| N | N | 47,702 |
| N | N | 46,453 |
| N | N | 47,224 |
| N | N | 47,523 |
| N | N | 49,362 |
| N | N | 49,225 |
| N | N | 47,668 |
| N | N | 46,877 |
| N | N | 46,751 |
| N | N | 46,425 |
| N | N | 47,866 |
| N | N | 48,761 |
| N | N | 50,488 |
| N | N | 51,121 |
| N | N | 51,514 |
| N | N | 52,432 |
| N | N | 51,735 |
| N | N | 50,249 |
| N | N | 49,836 |
| N | N | 49,594 |
| N | N | 50,148 |
| N | N | 51,719 |
| N | N | 52,471 |
| N | N | 53,551 |
| N | N | 55,497 |
| N | N | 56,895 |
| N | N | 56,800 |
| N | N | 55,562 |
| N | N | 54,913 |
| N | N | 54,865 |
| N | N | 54,674 |
| N | N | 55,278 |
| N | N | 55,689 |
| 123524 | 22810 | 56,436 |
| 121211 | 22138 | 54,423 |
| 116663 | 21290 | 54,059 |
| 117006 | 22153 | 52,646 |
| 118033 | 22647 | 51,842 |
| 119844 | 23216 | 51,759 |
| 120636 | 23787 | 51,939 |
| 122558 | 25108 | N |
| labor | labor | median |
| force | force | income |
| domestic | foreign | |
| born | born | |
| [1000s] | [1000s] |
| Recession |
|---|
| November 1948 to |
| October 1949 |
| - |
| - |
| - |
| July 1953 to |
| May 1954 |
| - |
| - |
| August 1957 to |
| April 1958 |
| - |
| April 1960 to |
| February 1961 |
| - |
| - |
| - |
| - |
| - |
| - |
| - |
| December 1969 to |
| November 1970 |
| - |
| - |
| November 1973 |
| to |
| March 1975 |
| - |
| - |
| - |
| - |
| Jan to Jul 1980 |
| July 1981 to |
| November 1982 |
| - |
| - |
| - |
| - |
| - |
| - |
| - |
| July 1990 to |
| March 1991 |
| - |
| - |
| - |
| - |
| - |
| - |
| - |
| - |
| - |
| Mar - Nov 2001 |
| - |
| - |
| - |
| - |
| - |
| December 2007 |
| to |
| June 2009 |
| - |
| - |
| - |
| - |
| - |
| GDP |
|---|
| 2,020.0 |
| 2,008.9 |
| 2,184.0 |
| 2,360.0 |
| 2,456.1 |
| 2,571.4 |
| 2,556.9 |
| 2,739.0 |
| 2,797.4 |
| 2,856.3 |
| 2,835.3 |
| 3,031.0 |
| 3,108.7 |
| 3,188.1 |
| 3,383.1 |
| 3,530.4 |
| 3,734.0 |
| 3,976.7 |
| 4,238.9 |
| 4,355.2 |
| 4,569.0 |
| 4,712.5 |
| 4,722.0 |
| 4,877.6 |
| 5,134.3 |
| 5,424.1 |
| 5,396.0 |
| 5,385.4 |
| 5,675.4 |
| 5,937.0 |
| 6,267.2 |
| 6,466.2 |
| 6,450.4 |
| 6,617.7 |
| 6,491.3 |
| 6,792.0 |
| 7,285.0 |
| 7,593.8 |
| 7,860.5 |
| 8,132.6 |
| 8,474.5 |
| 8,786.4 |
| 8,955.0 |
| 8,948.4 |
| 9,266.6 |
| 9,521.0 |
| 9,905.4 |
| 10,174.8 |
| 10,561.0 |
| 11,034.9 |
| 11,525.9 |
| 12,065.9 |
| 12,559.7 |
| 12,682.2 |
| 12,908.8 |
| 13,271.1 |
| 13,773.5 |
| 14,234.2 |
| 14,613.8 |
| 14,873.7 |
| 14,830.4 |
| 14,418.7 |
| 14,783.8 |
| 15,020.6 |
| 15,369.2 |
| 15,710.3 |
| 16,205.6(III) |
| Billions 2009 dollars |
| DPCERY2 |
|---|
| N |
| N |
| N |
| N |
| N |
| N |
| N |
| N |
| N |
| N |
| N |
| N |
| N |
| N |
| N |
| N |
| N |
| N |
| N |
| N |
| N |
| 1.88 |
| -0.59 |
| 3.98 |
| 5.63 |
| -0.69 |
| -3.49 |
| 2.61 |
| 3.23 |
| 3.62 |
| 1.93 |
| 0.61 |
| 3.32 |
| -1.8 |
| 4.51 |
| 4.06 |
| 3.29 |
| 0.62 |
| 1.62 |
| 0.57 |
| 2.93 |
| 1.13 |
| -1.96 |
| -0.07 |
| 3.08 |
| 2.33 |
| 2.83 |
| 1.83 |
| 2.08 |
| 3.07 |
| 3.88 |
| 3.93 |
| 2.35 |
| 4.06 |
| 1.44 |
| 2.12 |
| 2.78 |
| 1 |
| 2.75 |
| 0.34 |
| -3.16 |
| -0.01 |
| 2.79 |
| 0.94 |
| 1.32 |
| 2.51 |
| 2.21 |
*,**One & Two: Source: to find the tables go here Data Retrieval: Labor Force Statistics (CPS)
HOUSEHOLD DATA Table A-7. Employment status of the civilian population by nativity and sex, not seasonally adjusted [Numbers in thousands]
Employment status and nativity. Then
Scroll down to "Retrieve Data"
The data that I include above are from the month of December except for 2014 where November is the last month with data available.
***Three: For the Census Bureau income data go here. Choose "Consumer Income Reports (P60)" then choose "P60-249 Income and Poverty in the United States: 2013" (pdf file).
| Table Information |
|---|
| I've combined several tables into one. Most of the tables were obtained here: go to Bureau of Labor Statistics (BLS) Labor Force Statisics from the Current Population Survey (CPS). Make your selections. I chose quarterly data. I took the fourth quarter data from each table and combined them into the main part of the table above. For the year 2014 I took the third quarter data and marked the data with (III). |
| pop. Population data |
|---|
| Go hereU.S. population and US Census clock, Dec 22, 2014 319.47 million |
| Employment-population ratio |
|---|
| Employment-population ratio defined in BLS art4full.pdf file. |
| Civilian labor force participation rate |
|---|
| Civilian labor force participation rate defined in BLS art4full.pdf file. |
| Unemployment rate |
|---|
| Unemployment rate of the full-time labor force defined in BLS art4full.pdf file. |
| Recession |
|---|
| CENSUS BUREAU, BUREAU OF LABOR STATISTICS SOURCES |
| National Bureau of Economic Research, Inc. Cambridge MA 02138 US Business Cycle Expansions and ContractionsLink from BLS SPOTLIGHT ON STATISTICS THE RECESSION OF 2007 – 2009 |
|
| GDP in billions of chained 2009 dollars (Seasonally adjusted annual rates) |
|---|
| GDP 1929 - 2014 |
| DPCERY2 Personal consumption expenditures |
|---|
| The GDP Personal consumption expenditures percentage hover GDP Personal consumption expenditures percentage for Percent Change in Real Gross Domestic Product US Department of Commerce, Bureau of Economic Analysis (BEA) Gross Domestic Product (GDP) If you are not at Gross Domestic Product (GDP) search for it. It should be on page http://www.bea.gov/national/index.htm. Then click on
I did not know which tables to look for so I chose to download them all in csv format. I clicked on Section 1 (2852.7k) I used Table 1.1.2. Contributions to Percent Change in Real Gross Domestic Product |
Footnotes
N Not available.
Z Represents or rounds to zero.
Disclaimer: Opinions posted on Free Republic are those of the individual posters and do not necessarily represent the opinion of Free Republic or its management. All materials posted herein are protected by copyright law and the exemption for fair use of copyrighted works.