Posted on 04/15/2026 4:47:08 AM PDT by MtnClimber
I spent the past couple of days attending the International Conference on Climate Change, put on by the Heartland Institute in Washington. There was a good deal of material that will be of interest to readers.
A major issue addressed by multiple presenters goes under the heading “What is the proof?”, and in particular what is the proof that there is some kind of climate “crisis” coming our way. You will not be surprised to learn that for most every claim of the climate cabal, the proof is lacking.
The most interesting presentation on this subject came from John Clauser. For those who haven’t heard of him, Clauser was one of the co-winners of the Nobel Prize in physics in 2022. The specific subject of Clauser’s prize was something called “quantum entanglement,” which seems to be only peripherally related to climate change. However, Clauser’s presentation made it look like since winning the prize he has spent much of his time studying the literature on climate change, and particularly studying the data that are cited to support claims of impending climate crisis. Over that period, he has become a very outspoken climate skeptic. He is clearly a very smart guy, with a sharp critical eye. Also, he has taken a specific approach, which is to examine the data looking for gaps, alterations or manipulations that might render the data insufficient to support the claims being made. (See also, my series on The Greatest Scientific Fraud Of All Time.) I think that this approach is the essence of the scientific method, but sadly it is mostly absent from the climate “science” cult. Finally, Clauser has specifically focused on certain flaws or manipulations of the data that can be seen easily and understood by a layman without any need for specific scientific expertise.
Clauser titled his talk “Global warming, climate change, and scientific consensus have not been proven. There is no proven climate crisis.” The talk was accompanied by a Power Point deck of some 124 slides, which were way too numerous and detailed for him to cover everything or for an audience member to take thorough notes. However, I managed to get my hands on a copy of the deck. (Clauser’s full talk is available on the Heartland website, and I also understand that the deck will be available on the website within a few days.)
Today I will start with the part of Clauser’s presentation relating to the issue of what are called “extreme weather events” — e.g., floods, droughts, hurricanes, tornadoes, heat waves, and the like. For this sub-topic, Clauser began with a 2012 article from Physics Today by Jane Lubchenco and Thomas Karl, titled “Predicting and managing extreme weather events.” (L&K) At the time of the article, which was during the presidency of Barack Obama, Lubchenco was the Administrator of NOAA, and Karl was Director of NOAA’s National Climatic Data Center and Chair of the US Global Change Research Program. In other words, these were the people then in charge of collecting the U.S. weather data, including data on extreme weather events, on behalf of the government. As Clauser noted in his talk, if there were any people who would have access to the very best data to support a claim of increasing extreme weather, it would be these two.
The thesis of the L&K piece is that extreme weather events in the U.S. have been increasing, and can be expected to increase further as the climate warms. Here’s the introductory paragraph:
Earth’s climate is warming, and destructive weather is growing more prevalent. Coping with the changes will require collaborative science, forward-thinking policy, and an informed public.
Besides making their own statement to that effect, L&K also quote multiple similar statements from the IPCC:
“It is very likely that heat waves will increase in length, frequency, and/or intensity over most land areas. . . . It is likely that the average maximum wind speed of tropical cyclones will increase throughout the coming century. . . . It is likely that the frequency of heavy precipitation or the proportion of total rainfall from heavy falls will increase in the 21st century over many areas of the globe.”
So what is the proof?
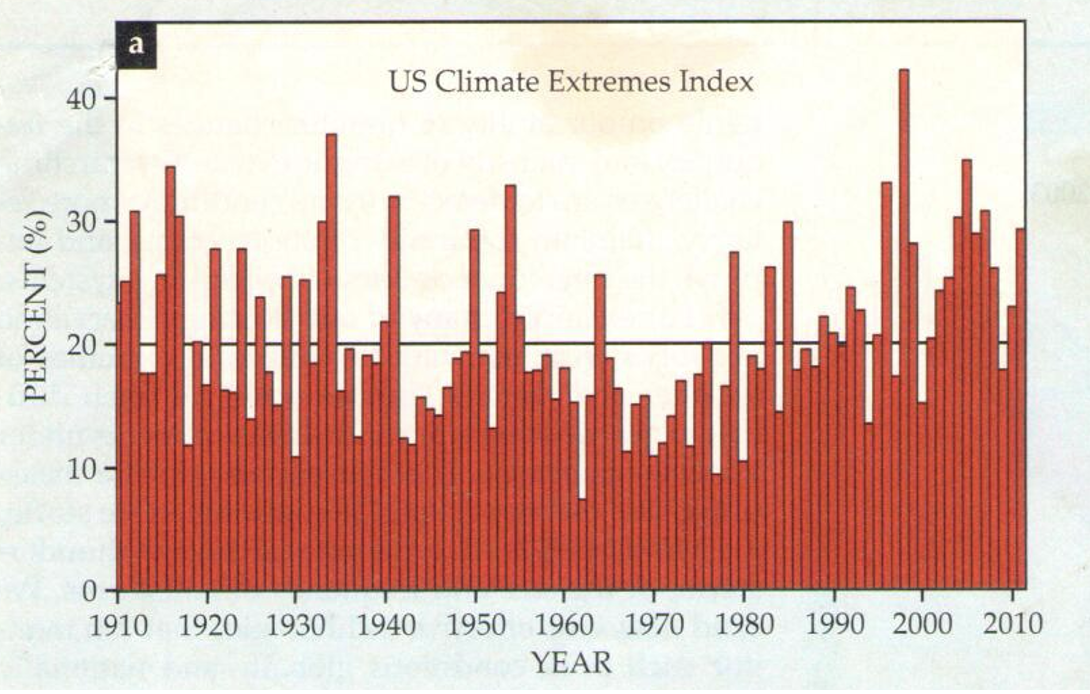
L&K present a series of charts that they assert establish the proposition that extreme weather events in the U.S. have “grown steadily over the past several decades.” To measure the level of these extreme weather events within the U.S., L&K come up with something they call the “US Climate Extremes Index.” They describe the Index as having been calculated based on “the area percentage of the country experiencing extreme monthly temperature, drought severity, soil water surplus, days with and without precipitation, land-falling hurricane activity, and one-day heavy precipitation events in any given year.” However, beyond that description, there is nothing in the way of a technical description and backup of how the charts have been constructed quantitatively. A footnote with a link to a prior Karl article on the subject, presumably containing these details, returns a message “not found.”
My first comment on this “Climate Extremes Index” is that it is an extremely dubious metric, obviously subject to very easy manipulation. For example, who has decided how much land area was covered by a particular “land-falling hurricane”? Is it just the land area where the wind speeds exceeded 75 mph, or is it the entire area overswept by the hurricane storm system over its full life span of possibly several days, mostly with far lower windspeeds? Hidden decisions like that could easily be used to manipulate an index like this to produce a desired result.
However, Clauser does not go there, and instead he just takes the values of the index as presented by L&K and asks whether they actually increased over the period covered. Here is Figure 2a from L&K, showing the values of their U.S. Climate Extremes Index over the period 1910 to 2011:
If you look at that and don’t see any particular increase, let alone some dramatic surge in recent years, you won’t be the only one.
And it gets worse. Clauser took the values of the Index shown on the bar graph, and re-plotted them as dots on a scatter diagram. Then he did another plot where he reversed the order of the observations, so that the newest observations were on the left and the older on the right. In other words, the two plots are mirror images of each other. Here they are:
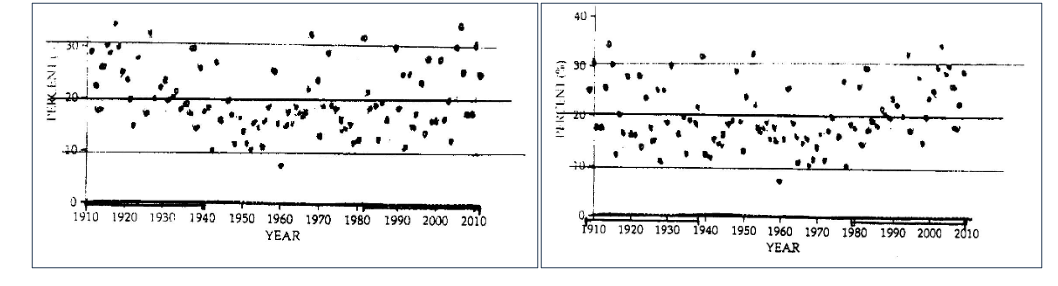
The years on the x-axis both indicate that they run from oldest to newest, but Clauser states that he has left it that way intentionally to challenge the observer to figure out which chart is plotted backwards. Here is Clauser’s text from his slide 9:
The two graphs are identical, except that one is plotted left-to-right reversed, i.e. backwards, with time increasing to the left. (If you look carefully, you will see that they are mirror images of each other.) I assert that if you can’t tell which one of these graphs is correctly plotted and which one is time-backwards, then Lubchenco and Karl’s claimed recent increase in extreme weather-event frequency is not obviously indicated by their data. One of these graphs is claimed by Lubchenko and Karl to forecast an impending climate apocalypse! Are you really confidently willing to bet trillions of dollars that you can tell which one makes that forecast?
Clauser concluded this segment of his presentation by calling L&K’s conclusion “fraudulent pseudoscience.” It is an odd sort of fraudulent pseudoscience — baldly asserting that a collection of data supports a conclusion that the data obviously do not support, and expecting everyone to just nod along. It’s hard to believe that with all the data at their disposal, this is the best that L&K could come up with to prove the case of increasing extreme weather events. But that’s a lot of how “climate science” works.
Next up: Earth’s Energy Imbalance (EEI).
Manhattan Contrarian ping
Glowbull warming is not a science, it’s a religion. All the logic and facts in the world will not change the minds of the mindless. It goes hand in hand with these clowns still wearing covid masks and social distancing. It’s all mental illness sponsored by our favorite political party.
Many do not & probably won’t soon realize who controls the climate. Here’s a clue...it’s not mankind. Our winter (just over I guess)was really a non-winter in comparison. We had good weather almost all of the season & only a few really cold days & a pinch of snow here & there. I have no idea of what summer will be like, but it could be a complete surprise like winter. Right now, we need moisture as it is rather semi-arid here.
It’s April in East Tennessee.......
Today the high will be 85° or so. We have drought rather than April showers
Can I get on the “Manhattan Contrarian” Ping List please?
I love me some Manhattan Contrarian! Thanks for posting it...:)
I have no doubt the climate is changing.
Because the climate has always been changing.
And the climate will always be changing.
I view this as a healthy sign in people.
The more someone views this subject and the associated data, the more they are inclined to develop a well rounded and based skepticism of Anthropogenic Climate Change.
Wacky weather forecasters. I miss Sonny Eliot (Marvin Schlossberg) American meteorologist, actor and comedian, who was known for making jokes during his weather broadcasts (metro Detroit)
Absolutely. The key thing is: the belief in Anthropogenic (Man-caused) climate change.
It is key. We believe the climate changes because that is nature at work. They believe we are the key driver of ANY climate change, as if it had been somehow unchanging over the eons since the formation of the Earth, which is ludicrous.
OK, you are on the Manhattan Contrarian ping list.
Excellent! Thank you...
I saw a video one time where a guy took all the slides from a global warming presentation and then looked at the source data. Every slide had a different starting time period. He proved that the timeline on every slide started at the most advantageous time to prove the presenters point, but when you looked back there were just obvious cycles and overall the slides meant nothing.
This was the thing that made me personally sit up and take an active stance against the Climate Change Cult: When I saw the revelations from the famous team at East Anglia University (as revealed in their emails) that they were wholly trying to find ways to change the data to support their assertions of anthropogenic climate change, because their data did not support it.
And not just in the email discussions-but in the coding comments that were found inside the software model that explicitly stated that this piece of code or that one was there to make the data fit.
And for me, even more telling, was their reaction when these things were revealed, that they were FAR more interested in going after the people who brought their emails and source code into the light than in explaining or logically dismissing the arguments against their fraud with facts and reason...for the simple fact that it was impossible for them to do.
So, they pounded their shoe on the table instead.
That is fully what made me wholly skeptical. Remember, up until those revelations, most (not all) average people just accepted climate change as a fact, as they had been bombarded for years with Government, Media, Education, and even Entertainment narratives saying something had to be done about it or we were doomed.
Yes, I know the one you are talking about.
That might well have been Lord Christopher Monckton (though I could be mistaken) who used the chart of temperature measurements over time and used a moving average coupled with a straight trendline and then displayed that trend line (which smooths the data) in various time frames.
Coincidentally-or not conincidentally-he was able to show that while the trendlines they showed to support their assertions of increasing global temperatures that were caused by man, he was able to show just as many or many more that showed declines in temperature over time.
As you sagely pointed out, they were trying to be clever by half in their selective choice of where they wanted their trendline data set to begin.
They likely thought they were so clever that nobody would notice.

Well....yeah....more people and things to hit plus inflation will do that.
I think what you're saying is kinda the same thing.
The industrial revolution was used in many studies...because it concluded "Man did it"...
Wow, I never knew that
Still waiting for THE COMING ICE AGE of the 1970s!
https://wattsupwiththat.com/2013/03/01/global-cooling-compilation/
Disclaimer: Opinions posted on Free Republic are those of the individual posters and do not necessarily represent the opinion of Free Republic or its management. All materials posted herein are protected by copyright law and the exemption for fair use of copyrighted works.