
Posted on 02/10/2022 7:36:35 PM PST by MinorityRepublican
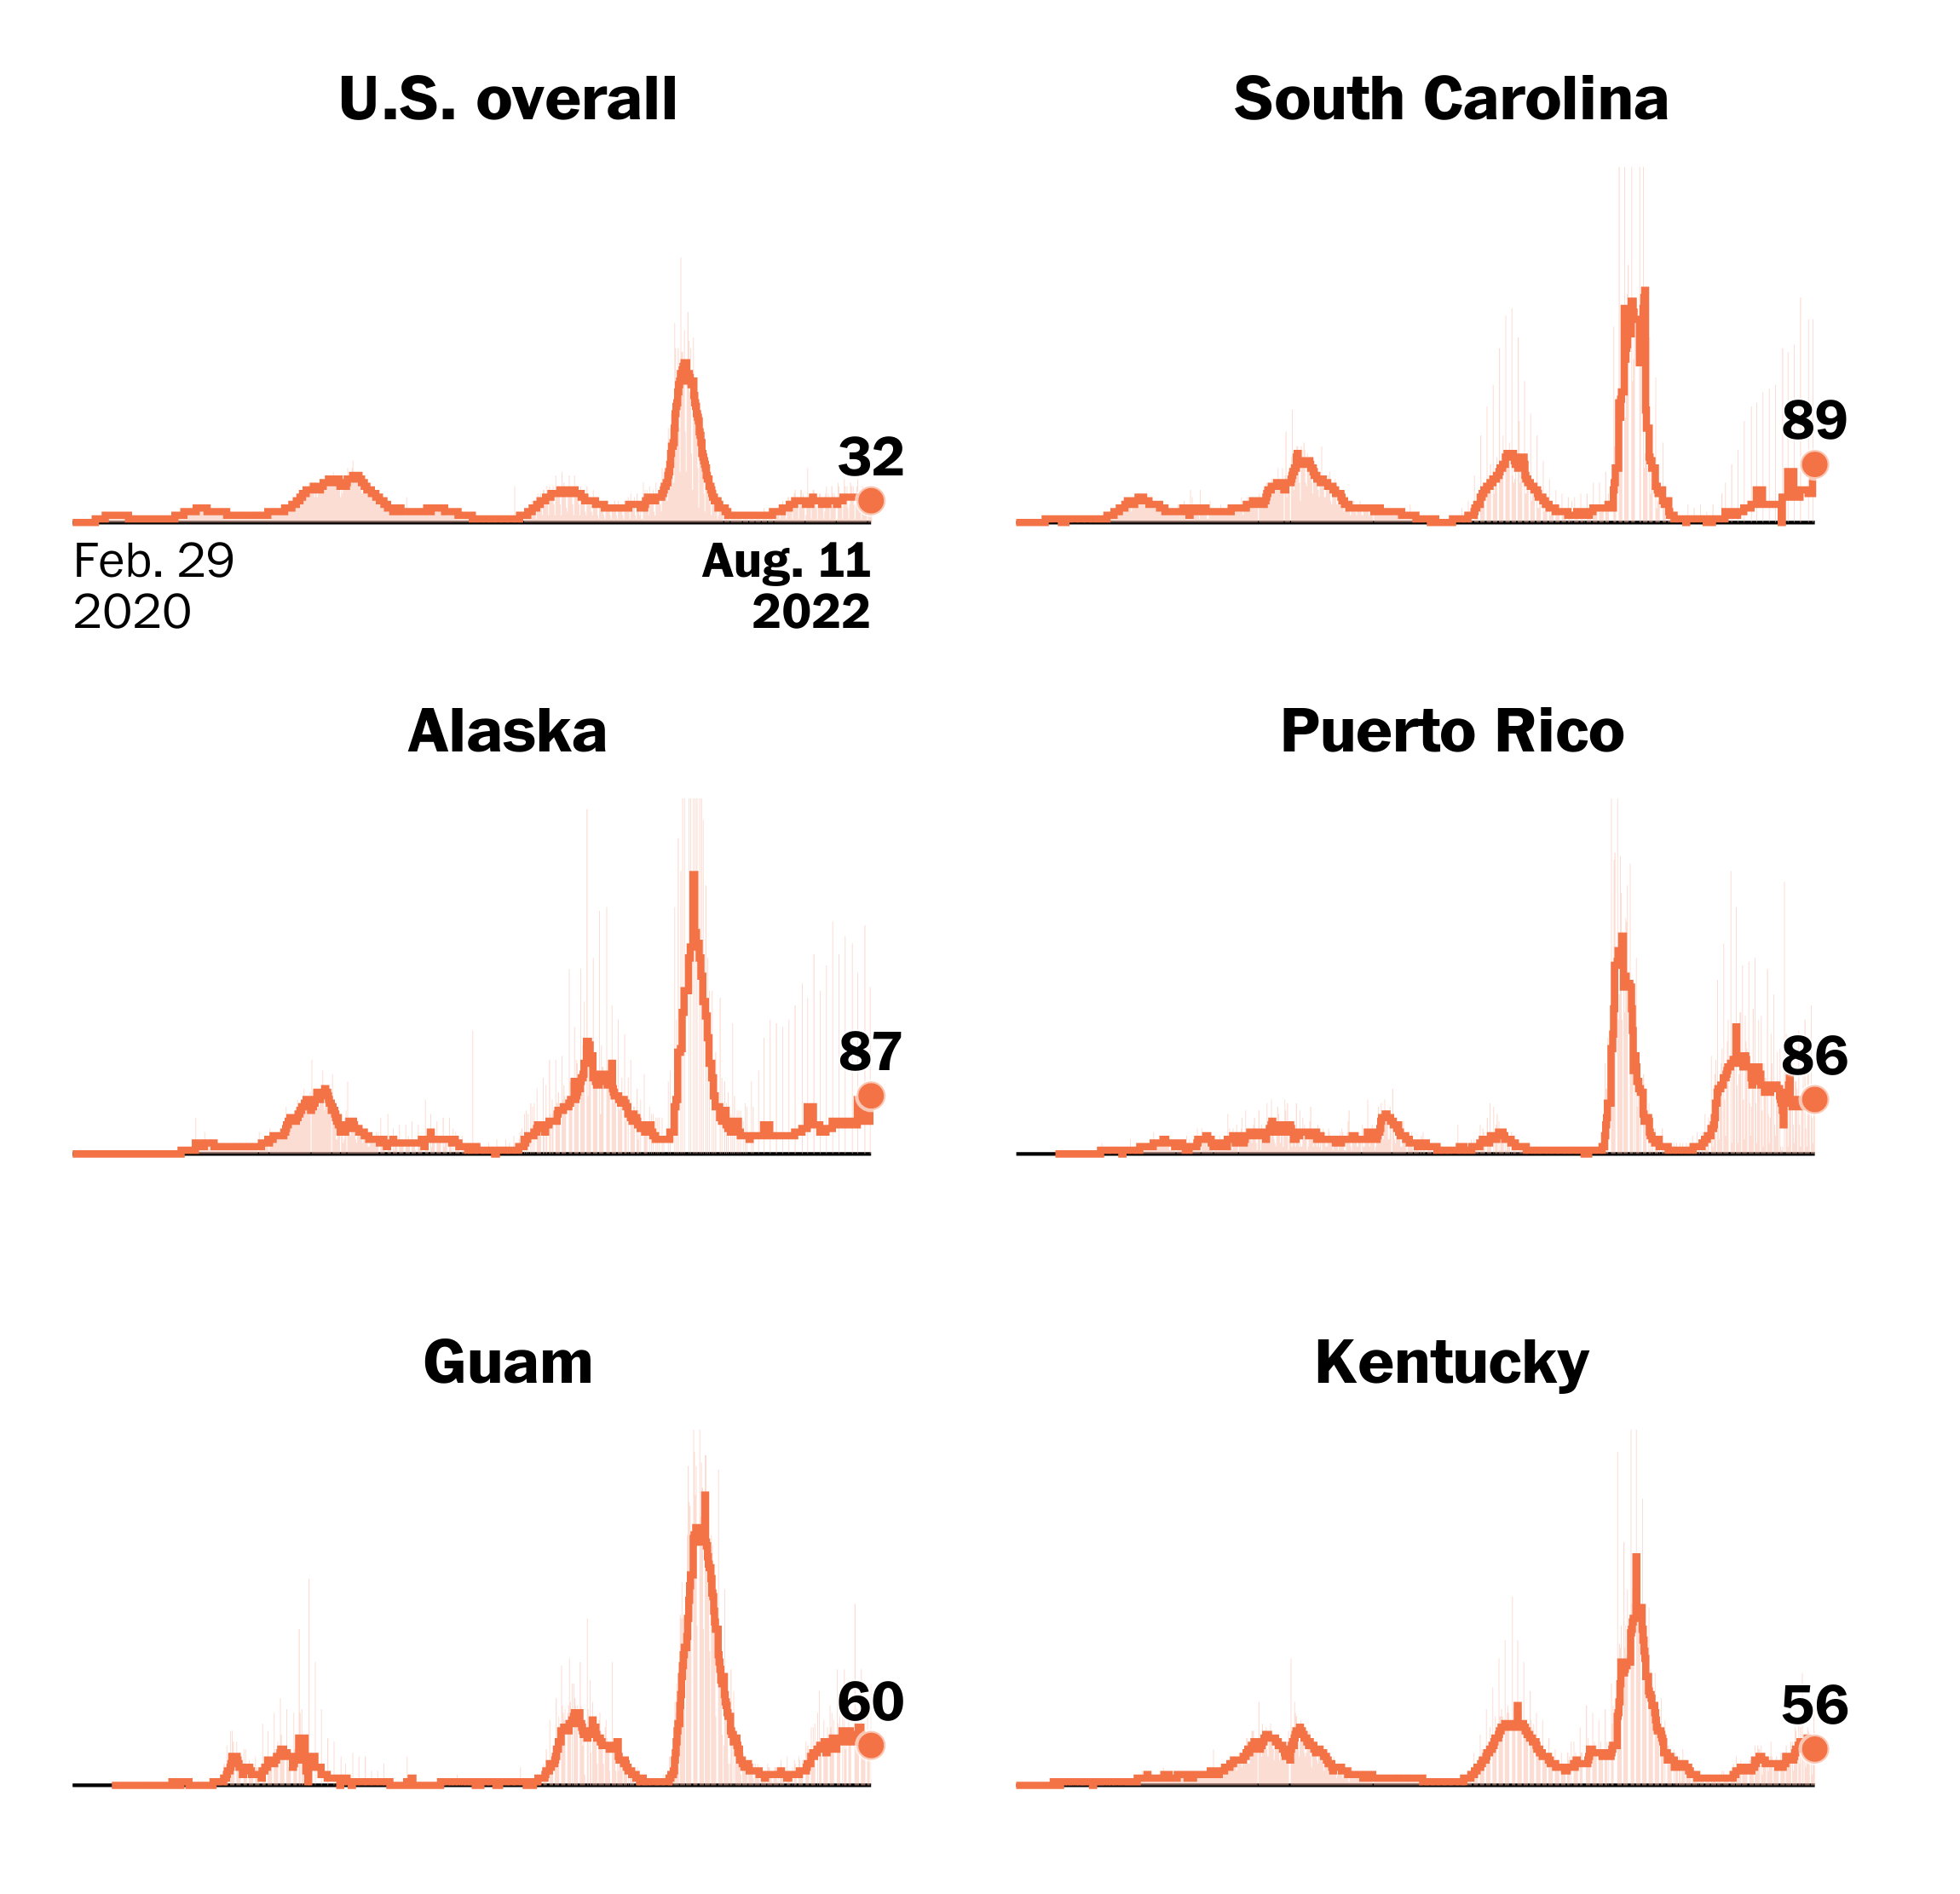
Places with highest daily reported cases per capita
Seven-day average of daily new reported cases per 100,000 residents
How many vaccine deaths?
Correction - 2,465 deaths and 179,237 new cases.
I didn’t check which states did not report. Yesterday’s number of deaths grew quite a bit and maybe isn’t done. Nearly 3K.
2465 plus laggards will likely be sub 3000. The decline for spring looks in place, but it’s just not the same slope as last year.
The usuals, MI, TN . . . Washington looks suspect. 22 a week ago to 2. They may have laggards internally.
Probably more like 50 deaths. You bitch about fake news yet post it every night
Looks same as the Excess Deaths curve.
Russia posted 700 dead today, but in your world that would be 12. I suppose they post 700 because they want to look more disease infested and discourage any commerce.
There is indeed an ideological debate coming.
Last year 25% more seniors 65+ died than die in a typical pre Covid year, adjusted for the opioid surge and raw population gain.
That 25% number doesn’t extend downward sub 65. There are deaths younger, but most are 65+.
The next variant will likely pose the question . . . should other ages have a responsibility to take any actions at all to reduce death counts 65+? Or is “protect the vulnerable” to be defined as isolate the elderly and keep them away from other people?
The other subtle issue, regardless of the politics and reality that seniors vote more densely than younger ages, is the impact senior deaths have on overall societal life expectancy. Will a safe 40 year old choose to take no actions at all, even if he knows he’s losing X years off his expected life?
It will be tricky.
“0.27%” deaths.
You would think 3 in 5 people were dropping in the streets if you watch most media.
I notice 24% of 85+ people who got infected died.
Life expectancy of an 85 year old is 6 years for males, 7 years for females according to Soc. Sec. tables.
So it’s not like the 85 yr old only loses a few weeks.
It should be up to 65+ to decide to take the risks for themselves. They can go on the cruise they've always wanted to go on. Or they can stay at home.
Likely we'll see a lull in the summer. If that's the case, we'll have to watch for a new variant to emerge just in time for the next winter.
I understand the sentiment. But, the media hype anything they can. It brings in viewers and viewers = big $$.
That said, consider: Adjusted for population now vs. then, COVID has been knocking off Americans at faster rate on average than did WW2.
“hype”
Do you think all the Pfizer ads have anything to do with all the hype? Do we think their agenda is reporting the news when it’s actually ad revenue?
EARTH CALLING OWEN!!! EARTH CALLING OWEN!!!
Life insurance industry reps have stated that death rates among 18 to 64 year olds are up 40%... This has been all over the news for over a month. How did you miss it?
https://www.wfyi.org/news/articles/insurance-death-rates-working-age-people-up-40-percent
That story was out 6 weeks ago.
CDC confirmed Excess Deaths. Attributed partly to fentanyl.
But if Covid is broadening target age, there won’t be a quandary. Whatever restrictions are demanded will be demanded decades before 65+.
Is there any differentiation between 85+ who died of COVID or with COVID?
As of 11 February 2022 ---
https://www.worldometers.info/coronavirus/
USA, regularly first on Worldometer's report of deaths, with 333,928,328 population, is among the WORST in the world with a reported 939,427 Covid deaths over twenty-five months. ( 939,427 / 333,928,328 ) x 100 = 0.281 % US mortality rate
Over two years. Over three and a half times the global mortality rate, under the failing pandemic leadership of Fauci, the NIH, CDC and FDA. Among the worst response in the world, suggests the deadly data.
Give a 0.281 % mortality rate over more than two years, the survivability rate for Americans and Covid is 99.7 percent nationwide (100% - 0.281 % ).
"Places" -- in this case the US -- and reported deaths. And a mortality rate calculated not yearly, but now over twenty-five months of 0.281 %.
Daniel observed: "You would think 3 in 5 people were dropping in the streets if you watch most media."
0.281 % mortality rate as of 11 February 2022. 99.7 % of the population survive for any and all reasons. After twenty-five months of the pious litany of counting the dead. Amen.
Indeed. But when that actually happens who will turn to Christ in repentance and faith?
Thanks. I had 910,104 deaths out of 334,000,000 Pop. = 0.27% using a different source for US pop rounded, while including the astronomical 24.3% CFR for those 85+ - most of whom would likely soon die anyway (makle life exp. 72.76) - skews the whole CFR. Calculating the % of the pop. per age group in relation to Covid would give a better picture of its threat. About 16% of the U.S. population was 65 years old or older in 2018

| Years | 1910 | 1920 | 1930 | 1940 | 1950 | 1960 | 1970 | 1980 | 1990 | 2000 | 2010 | 2018 |
|---|---|---|---|---|---|---|---|---|---|---|---|---|
| Median age of the total population | 24.1 | 25.3 | 26.5 | 29.0 | 30.2 | 29.6 | 28.1 | 30.0 | 32.9 | 35.3 | 37.2 | 38.2 |
| Median age of males | 24.6 | 25.8 | 26.7 | 29.1 | 29.9 | 28.7 | 26.8 | 28.8 | 31.7 | 34.0 | 35.8 | 36.9 |
| Median age of females | 23.5 | 24.7 | 25.2 | 29.0 | 30.5 | 30.4 | 29.8 | 31.2 | 34.1 | 36.5 | 38.5 | 39.5 |
Disclaimer: Opinions posted on Free Republic are those of the individual posters and do not necessarily represent the opinion of Free Republic or its management. All materials posted herein are protected by copyright law and the exemption for fair use of copyrighted works.
