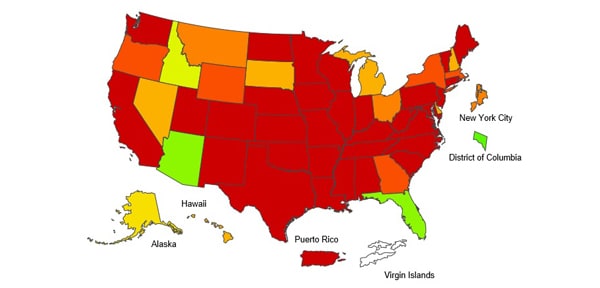
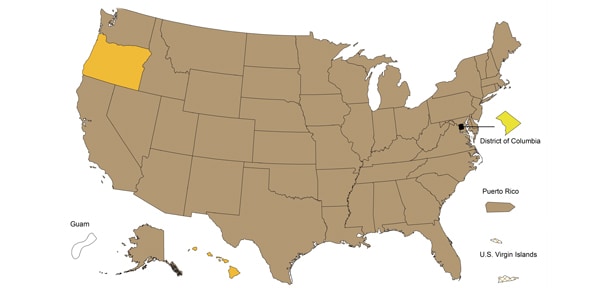
COVID-19 cases as of 3-12-20 compared with 2018 death rates for the Flu.
While COVID-19 has hardly competed its run, yet for comparison with the Flu, although I cannot find the stats for the number of cases of flu per state for this season, yet I did find the morality rate for the flu per state in 2018, which I have added to the table below, as well as the latest morality count for COVID-19. Additional stats on the 201902020 Flu season are provided below the the table.
“The Centers for Disease Control predicts at least 12,000 people will die from the flu in the US every year. In the 2017-2018 flu season, as many as 61,000 people died, and 45 million were sickened. In the 2019-2020 season so far, at least 26 million people in the US have gotten the flu and at least 14,000 people have died from it, including at least 92 children. Flu activity has been widespread in nearly every region, with high levels of activity in 48 states and Puerto Rico, the CDC reported this week.” (https://www.cnn.com/2020/01/30/health/flu-deadly-virus-15-million-infected-trnd/index.html)
Meanwhile, the NYT today (3-13) sounds this alarm: “Between 160 million and 214 million people in the U.S. could be infected over the course of the epidemic, according to one projection. That could last months or even over a year, with infections concentrated in shorter periods, staggered across time in different communities, experts said. As many as 200,000 to 1.7 million people could die.” (https://www.nytimes.com/2020/03/13/us/coronavirus-deaths-estimate.html)
Below is a list of states per currently reported COVID-19 infections (by CNN, of 3-12-20) in comparison with population size (note that variations in reported cases are partly be due to how comprehensive testing can and has been done). Use an online calculator here, (see second row under “Percentage Calculator in Common Phrases,” and remove commas in population figure) for cases as a percent of population.
In any case, I pray all this, real or inflated, works to bring souls to realize the need for help from above, for repentance and mercy from God through faith in the risen Lord Jesus.
|
State |
Population |
COVID-19 cases |
Percent of infections by capita |
Deaths from COVID-19 (as of 3-12-20) |
Deaths from Flu in 2018 (last available data from CDC) |
|
Washington |
7,614,893 |
373 |
|
31 |
930 |
|
New York |
19,453,561 |
216 |
|
|
4,749 |
|
California |
39,512,223 |
139 |
|
4 |
6,917 |
|
Massachusetts |
6,949,503 |
95 |
|
|
1,441 |
|
Colorado |
5,758,736 |
33 |
|
|
568 |
|
Georgia |
10,617,423 |
31 |
|
1 |
1,530 |
|
Florida |
21,477,737 |
29 |
|
2 |
3.091 |
|
Illinois |
12,671,821 |
25 |
|
|
2,564 |
|
New Jersey |
8,882,190 |
23 |
|
1 |
1,465 |
|
Texas |
28,995,881 |
21 |
|
|
3,516 |
|
Oregon |
4,217,737 |
19 |
|
|
530 |
|
Pennsylvania |
12,801,989 |
15 |
|
|
2,887 |
|
Iowa |
3,155,070 |
14 |
|
|
697 |
|
Louisiana |
4,648,794 |
14 |
|
|
824 |
|
Maryland |
6,045,680 |
12 |
|
|
973 |
|
North Carolina |
10,488,084 |
11 |
|
|
2,064 |
|
District of Columbia |
705,749 |
10 |
|
|
N/A |
|
Indiana |
6,732,219 |
10 |
|
|
1,118 |
|
Nebraska |
1,934,408 |
10 |
|
|
394 |
|
South Carolina |
5,148,714 |
10 |
|
|
882 |
|
Wisconsin |
5,822,434 |
10 |
|
|
1,075 |
|
Arizona |
7,278,717 |
9 |
|
|
1,116 |
|
Virginia |
8,535,519 |
9 |
|
|
1.283 |
|
Kentucky |
4,467,673 |
8 |
|
|
969 |
|
South Dakota |
884,659 |
8 |
|
1 |
245 |
|
Nevada |
3,080,156 |
7 |
|
|
527 |
|
Tennessee |
6,833,174 |
7 |
|
|
1,646 |
|
Minnesota |
5,639,632 |
5 |
|
|
698 |
|
New Hampshire |
1,359,711 |
5 |
|
|
265 |
|
Rhode Island |
1,059,361 |
5 |
|
|
192 |
|
New Mexico |
2,096,829 |
4 |
|
|
365 |
|
Ohio |
11,689,100 |
4 |
|
|
2,395 |
|
Connecticut |
3,565,287 |
3 |
|
|
757 |
|
Utah |
3,205,958 |
3 |
|
|
353 |
|
Hawaii |
1,415,872 |
2 |
|
|
542 |
|
Michigan |
9,986,857 |
2 |
|
|
1,869 |
|
Oklahoma |
3,956,971 |
2 |
|
|
809 |
|
Vermont |
623,989 |
2 |
|
|
87 |
|
Arkansas |
3,017,825 |
1 |
|
|
670 |
|
Delaware |
973,764 |
1 |
|
|
167 |
|
Kansas |
2,913,314 |
1 |
|
|
630 |
|
Mississippi |
2,976,149 |
1 |
|
|
910 |
|
Missouri |
6,137,428 |
1 |
|
|
1,477 |
|
North Dakota |
762,062 |
1 |
|
|
152 |
|
Wyoming |
578,759 |
1 |
|
|
128 |
|
Alabama |
4,903,185 |
0 |
|
|
1,268 |
|
Idaho |
1,792,065 |
0 |
|
|
235 |
|
West Virginia |
1,787,147 |
0 |
|
|
539 |
|
Maine |
1,344,212 |
0 |
|
|
312 |
|
Montana |
1,068,778 |
0 |
|
|
152 |
|
Alaska |
731,545 |
0 |
|
|
68 |
As for the 2019-2020 Flu season:
|
2019-2020 Season |
|
|---|---|
|
Overall |
57.9 |
|
0-4 years |
84.9 |
|
5-17 years |
21.6 |
|
18-49 years |
31.2 |
|
50-64 years |
76.1 |
|
65+ years |
147.5 |
Among 2,528 hospitalized adults with information on underlying medical conditions, 91.9% had at least one reported underlying medical condition, the most commonly reported were cardiovascular disease, metabolic disorder, obesity, and chronic lung disease. Among 443 hospitalized children with information on underlying medical conditions, 48.5% had at least one underlying medical condition; the most commonly reported was asthma. Among 427 hospitalized women of childbearing age (15-44 years) with information on pregnancy status, 25.8% were pregnant. (https://www.cdc.gov/flu/weekly/index.htm#ILIActivityMap)
Outpatient Illness: ILINet Visits to health care providers for influenza-like illness (ILI) decreased from 5.5% last week to 5.3% this week. All regions remain above their baselines.
HospitalizationsThe overall cumulative hospitalization rate for the season increased to 57.9 per 100,000.
P&I Mortality The percentage of deaths attributed to pneumonia and influenza is 6.9%, below the epidemic threshold of 7.3%.
Pediatric Deaths 11 influenza-associated pediatric deaths occurring during the 2019-2020 season were reported this week. The total for the season is 136. - https://www.cdc.gov/flu/weekly/index.htm

