Skip to comments.
New Satellite Data Contradicts Carbon Dioxide Climate Theory
Co2insanity.com ^
| 11/15/2011 · 8:11 AM ↓ Jump to Comments
| John O’Sullivan
Posted on 11/28/2011 10:48:24 AM PST by Ernest_at_the_Beach
Industrialized nations emit far less carbon dioxide than the Third World, according to latest evidence from Japan’s Aerospace Exploration Agency (JAXA).
Global warming alarmism is turned on its head and the supposed role of carbon dioxide in climate change may be wrong, if the latest evidence from Japan’s scientists is to be believed.
Japanese national broadcaster, NHK World broke the astonishing story on their main Sunday evening news bulletin (October 30, 2011). Television viewers learned that the country’s groundbreaking IBUKU satellite, launched in June 2009, appears to have scorched an indelible hole in conventional global warming theory.
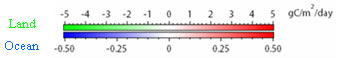
Standing in front of a telling array of colorful graphs, sober-suited Yasuhiro Sasano, Director of Japan’s National Institute for Environmental Studies told viewers, “The [IBUKU satellite] map is to help us discover how much each region needs to reduce CO2 [carbon dioxide] emissions.”
Industrialized Nations World’s Lowest CO2 ‘Polluters’
Indeed, the map at which JAXA spokesman Sasano was pointing been expected by most experts to show that western nations are to blame for substantial increases in atmospheric levels of carbon dioxide, causing global warming. But to an officious looking TV interviewer Sasano turned greenhouse gas theory on it’s head.
According to UN science the greenhouse gas theory says more CO2 entering the atmosphere will warm the planet, while less CO2 is associated with cooling.
Gesturing to an indelible deep green hue streaked across the United States and Europe viewers were told, “in the high latitudes of the Northern hemisphere emissions were less than absorption levels.”
Sasano proceeded to explain the color-coding system of the iconic maps showing where regions were either absorbing or emitting the trace atmospheric gas. Regions were alternately colored red (for high CO2 emission), white (low or neutral CO2 emissions) and green (no emissions: CO2 absorbers).
Bizarrely, the IBUKU maps prove exactly the opposite of all conventional expectations revealing that the least industrialized regions are the biggest emitters of greenhouse gases on the planet.
Yes, you read that correctly: the U.S. and western European nations are areas where CO2 levels are lowest. This new evidence defies the consensus view promoted by mainstream newspapers, such as the New York Times.
The Intergovernmental Panel on Climate Change (IPCC) had long claimed that, “there is a consensus among scientists that manmade emissions of greenhouse gases, notably carbon dioxide (CO2), are harming global climate.”
The Japanese satellite map shows regions colored the deepest leaf green (net absorbers of CO2) being predominantly those developed nations of Europe and North America; thus indicating built up environments absorbed more CO2 than they emitted into the atmosphere.
By contrast the bulk of the regions colored red (so-called ‘carbon polluters’) were in undeveloped, densely forested equatorial regions of Africa and South America.
Huge Headache for Climate Policymakers
JAXA boasts that, “we can reduce the error of the estimated values when we introduce IBUKI’s observation data compared to that of the values calculated in a conventional way based on ground observation data.”
To all policymakers who study the Japanese maps it is apparent that the areas of greatest CO2 emissions are those regions with least human development and most natural vegetation: Equatorial Third World nations.
The Japanese evidence also disproves the often-cited hypothesis that Siberia and other areas of northern Russia were natural vents for large scale CO2 outgassing, exacerbating global warming fears.
In effect, this compelling new data appears to show that the asphalt and concreted industrial nations are ‘mopping up’ carbon dioxide faster than their manufacturers and consumers can emit it. If this is confirmed, it means a cornerstone of man-made global warming may be in serious doubt.
Can Western Nations Still Proceed with Carbon Taxes?
But now that these so-called “global warming gases” have been precisely measured across the planet the quandary for international policymakers is what to do about plans to further implement international targets for CO2 reduction.
World leaders are getting set to face the latest round of UN climate change talks in Durban next month and must discuss a replacement for the soon to expire Kyoto Protocol, which binds nations to limited CO2 emissions.
The dilemma is whether the established UN global warming policy of the ‘polluter pays’ can any longer be sensibly upheld. Conventional political thinking at previous UN climate conferences was to ‘offset’ carbon emissions by making the worst polluters pay higher ‘carbon taxes.’
But that theory now appears to be rendered redundant being that western economies, believed to be the worst offenders, are in fact, contributing either negligible or no measurable CO2 emissions whatsoever.
Indeed, the IBUKU data indicates that the areas of highest CO2 emissions are precisely those regions with most vegetation and least industry and thus less able to pay.
Thus, the unthinkable could be made real: the greenhouse gas theory of climate change may collapse in the face of empirical evidence that industrialization is shown to have no link to global warming.
For more information the IBUKU achievement is published in the Scientific Online Letters on the Atmosphere (an online thesis magazine) issued by the Meteorological Society of Japan.
Sources:
JAXA, Japanese Aerospace Exploration Agency, Greenhouse Gas Observation Satellite ‘IBUKI’ (GOSAT), accessed online: October 30, 2011.
Gillis, J.,’Study Affirms Consensus on Climate Change,’ New York Times, (nytimes.com: accessed online: October 30, 2011)
Copyright. Contact the author to obtain permission for republication.
TOPICS: Business/Economy; Conspiracy; Science; Weather
KEYWORDS: climatechange; climategate; climategate2; durbanafrica; globalwarming; globalwarminghoax; unclimatefund
Navigation: use the links below to view more comments.
first 1-20, 21-39 next last
To: TigerLikesRooster; landsbaum; Signalman; NormsRevenge; steelyourfaith; Lancey Howard; ...
To: steelyourfaith
3
posted on
11/28/2011 10:50:12 AM PST
by
Army Air Corps
(Four fried chickens and a coke)
To: Ernest_at_the_Beach
Does this tend to support the assertion that temperature effects CO2 levels not vice versa.
To: Ernest_at_the_Beach
Thus, the unthinkable could be made real: the greenhouse gas theory of climate change may collapse in the face of empirical evidence that industrialization is shown to have no link to global warming.Very poorly written, but it doesn't appear to show that at all.
It shows varying concentrations of CO2 in the atmosphere in different areas, but doesn't really show how or where it entered the atmosphere.
CO2 IS increasing. That's a fact. If industrialization and fossil fuels have nothing to do with the increase, what's the alternative mechanism?
To: Ernest_at_the_Beach
Wow! Can’t wait to see this on CNNNBCCBSABCMSNBC.
6
posted on
11/28/2011 10:55:26 AM PST
by
MeganC
(Are you better off than you were four years ago?)
To: All
There is a map at the website .
To: Sherman Logan
You can rest easy and forget about Global Climate Change. The theory is dead and buried at this point.
The data shows Carbon Dioxide doesn’t cause global warming anyway.
8
posted on
11/28/2011 11:02:32 AM PST
by
o2bfree
To: Sherman Logan
Higher usage of open wood fires and coal/wood burning stoves in undeveloped/non-industrialized areas?
9
posted on
11/28/2011 11:05:34 AM PST
by
WayneS
(Comments now include 25 percent more sarcasm for no additional charge...)
To: Sherman Logan
“...CO2 IS increasing. That’s a fact. If industrialization and fossil fuels have nothing to do with the increase, what’s the alternative mechanism? ...”
Yup, that horrifying increase to almost 3 one hundredths of one percent is really hurting, isn’t it? After all, it’s responsible for our 10+ year cooling that we’re currently undegoing.
10
posted on
11/28/2011 11:06:10 AM PST
by
Da Coyote
(Liberalism - when you absolutely, positively have no ability to produce wealth.)
To: Ernest_at_the_Beach
No doubt they’ll wrap the data in correction factors and statistical gobbledigook until it gives the desired results.
Nothing may oppose the unfalsifiable hypothesis!
11
posted on
11/28/2011 11:07:33 AM PST
by
Jack of all Trades
(Hold your face to the light, even though for the moment you do not see.)
To: Sherman Logan
Lots of natural mechanisms emit CO.
12
posted on
11/28/2011 11:08:27 AM PST
by
meatloaf
(I've had it with recycling politicians in any way shape or form. Toss 'em out!)
To: WayneS
Wood fires don’t cause a significant net increase in carbon in the atmosphere. Trees take carbon out when they grow, then put it back when they are burned or decay. No net increase.
Coal is much dirtier (particulate) when it is burned in a low-tech stove than in high-tech power plant, but they release pretty much the same carbon.
What counts is the total amount of coal burned, not how it is burned. Low-tech coal burning stoves are a tiny percentage of world consumption.
To: Ernest_at_the_Beach
In the words of that famous philosopher and hero, Nelson Muntz...”ha ha”
14
posted on
11/28/2011 11:10:35 AM PST
by
class8601_nuke
(don't just be critical, be prompt critical.)
To: Sherman Logan
CO2 IS increasing. That's a fact. If industrialization and fossil fuels have nothing to do with the increase, what's the alternative mechanism? Warmer water holds less carbon dioxide. Carbon dioxide is released from the oceans as they warm. The oceans warm due to increased solar activity.
Ice core data suppports this alternate mechanism - past history shows that the warming preceeds CO2 increases by about 800 years
15
posted on
11/28/2011 11:10:45 AM PST
by
kidd
To: kidd
Just shot yourself down. We came out of the Little Ice Age around 1850, so present warming is something like 650 years early.
Look, I think it is just a fact that man is presently changing the composition of the atmosphere in minor degrees by putting massive amounts of stored carbon back into the atmosphere.
What effects, if any, this has on the climate is yet to be determined.
To: Ernest_at_the_Beach
Here is the project website, in English:
http://www.jaxa.jp/projects/sat/gosat/index_e.html
There's an image embedded in the lead article, but the original is really small.
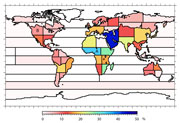
Let me see if I can expand it:
Well, that's ugly. and I'm not really sure what it says. I'll keep looking for a better version.
17
posted on
11/28/2011 11:16:27 AM PST
by
justlurking
(The only remedy for a bad guy with a gun is a good WOMAN (Sgt. Kimberly Munley) with a gun)
To: All
18
posted on
11/28/2011 11:27:32 AM PST
by
justlurking
(The only remedy for a bad guy with a gun is a good WOMAN (Sgt. Kimberly Munley) with a gun)
To: Sherman Logan
Present levels of CO2 and the present temperature are both very close to “average” for the earth’s history. In terms of the history of the past several hunderd million years, they are unremarkable.
The present (minor) increase in CO2 began several decades BEFORE the industrial revolution. It would be hard to argue that industrial activity is a cause of the CO2 increase when the increase started before industry did.
As far as how CO2 affect temperature, please see the Beer-Lambert Law. Here is a pretty good source: http://wattsupwiththat.com/2010/03/08/the-logarithmic-effect-of-carbon-dioxide/
19
posted on
11/28/2011 11:28:17 AM PST
by
kidd
To: Ernest_at_the_Beach
Hmmm...this report is certainly inconvenient...
20
posted on
11/28/2011 11:28:29 AM PST
by
jonno
(Having an opinion is not the same as having the answer...)
Navigation: use the links below to view more comments.
first 1-20, 21-39 next last
Disclaimer:
Opinions posted on Free Republic are those of the individual
posters and do not necessarily represent the opinion of Free Republic or its
management. All materials posted herein are protected by copyright law and the
exemption for fair use of copyrighted works.
FreeRepublic.com is powered by software copyright 2000-2008 John Robinson
 But, this image means nothing: it's simply a plot of the reduction in the uncertainty of the measurement for each region, by using the satellite data -- in comparison to data collected on the ground.