
I love watching the banned liberal troll formerly known as Mojo get checkmated.
#HeSoEasy
Posted on 11/24/2021 7:50:52 PM PST by fireman15
Vaccinated English adults under 60 are dying at twice the rate of unvaccinated people the same age And have been for six months. This chart may seem unbelievable or impossible, but it’s correct, based on weekly data from the British government.
The brown line represents weekly deaths from all causes of vaccinated people aged 10-59, per 100,000 people.
The blue line represents weekly deaths from all causes of unvaccinated people per 100,000 in the same age range.
I have checked the underlying dataset myself and this graph is correct. Vaccinated people under 60 are twice as likely to die as unvaccinated people. And overall deaths in Britain are running well above normal.
I don’t know how to explain this other than vaccine-caused mortality.
The basic data is available here, download the Excel file and see table 4:
(Excerpt) Read more at gellerreport.com ...
I love watching the banned liberal troll formerly known as Mojo get checkmated.
#HeSoEasy
Here is more:
According to this (arguably dated) Wikipedia breakout of the UK population (ca. 2011) into 5-year age bands, the "older people" are roughly uniform in breakout to the rest of the population.
| Ages attained (years) | Population | % of total |
|---|---|---|
| 0–4 | 3,914,000 | 6.2 |
| 5–9 | 3,517,000 | 5.6 |
| 10–14 | 3,670,000 | 5.8 |
| 15–19 | 3,997,000 | 6.3 |
| 20–24 | 4,297,000 | 6.8 |
| 25–29 | 4,307,000 | 6.8 |
| 30–34 | 4,126,000 | 6.5 |
| 35–39 | 4,194,000 | 6.6 |
| 40–44 | 4,626,000 | 7.3 |
| 45–49 | 4,643,000 | 7.3 |
| 50–54 | 4,095,000 | 6.5 |
| 55–59 | 3,614,000 | 5.7 |
| 60–64 | 3,807,000 | 6.0 |
| 65–69 | 3,017,000 | 4.8 |
| 70–74 | 2,463,000 | 3.9 |
| 75–79 | 2,006,000 | 3.2 |
| 80–84 | 1,496,000 | 2.4 |
| 85–89 | 918,000 | 1.5 |
| 90+ | 476,000 | 0.8 |
Are the "older people" those in the 55-59 band? Do you fellow FReepers who are 55-59 think of yourselves as "older people" yet?
Are we going to start calling those in the 50-54 band "older people" too?
According to the above table, the "older people" in the 55-59 band make up 8.7% of the population of 10-59, the smallest of the 5-year bands between 10-59. Assuming that not all of them were vaccinated, are we really to believe the implication of the footnote that less than 8% of the data is skewing the rest of the chart?
I conclude that the footnote 9 overstates the influence of "mortality rates for older people" on this data.
-PJ
Give up while you're behind, Mojo.

It's only a failed experiment if the outcome is unintentional. When you consider the source of the propaganda and who/what is behind the forced jabs, it is clear that the vaccines are 'working' exactly as planned.
Well, they did define down the definition of what a vaccine is, twice, in order to make it fit, kind of, what the COOF shots are. So, there is a precedence for it.
Really? In our current environment this is what you choose to call fear porn?
(I’d note many jab deaths come within 2 weeks of the second shot—when they are still officially counted as unjabbed, so even these numbers are low.)
You can’t compare the UK to the USA as it’s like comparing FL to NH at this point in time. It’s like stating FL has higher vaccine rates so they’re better. The Delta variant has come and gone in FL but has now started in NH…which is a highly vaxxed state.
UK has gone through this new variant and possibly has natural immunity and vaccine immunity as well. The USA is also far more populated and spread out.
There are some problems with this chart. (i) Vaccinated tend to be older and in poorer health than unvaxxed; is this “raw” data or has it been adjusted to reflect these differences? (ii) These are really small differences; differences of ~1 death/100,000 per week. Would like to see more data from longer time period to do statistics and see what the variances look like to see if this is statistically meaningful. It is clear a trend reversal occurred in an earlier period, was this just due to randomness?
I am not really sure what your point is?
~~~~
You would be more likely to get vaccinated if you had an underlying condition which would make you more likely to become critically ill should you catch COVID.
So this appears to be “death from all causes”.
I completely believe this. Further, I believe that reality is that the rates have very little to do with vaccine status, but instead a difference in ATTITUDE between those who are prone to follow government mandates and those who snub government control. Your attitude and determination to lead a well-rounded life as much as possible no matter the circumstances that occur in your life are the determining factors for health and longevity. Forget the “disease” as much as possible, and just LIVE!!!
Deaths from suicide and other results of DEPRESSION due to lack of human contact as well as other effects of the ANTI-SOCIAL DISTANCING policies probably play a huge role in these figures.
In this context it means average age of one group is higher than the other.
Do you think that "early prioritization" had such an ongoing effect?
Considering that the UK didn't approve the vaccines for those under 18 until September it had a very large effect on this statistic. There are a lot of people between 0-18.
Shouldn't the death rate from "other than COVID" (not charted) be the same in both populations?
Yes, assuming the populations are demographically similar. These aren't. One is older than the other.
The absolute mortality rate for a particular age band isn't important for this analysis. What matters is the all-cause death rate increases with age. I didn't research the UK but here's the US chart:
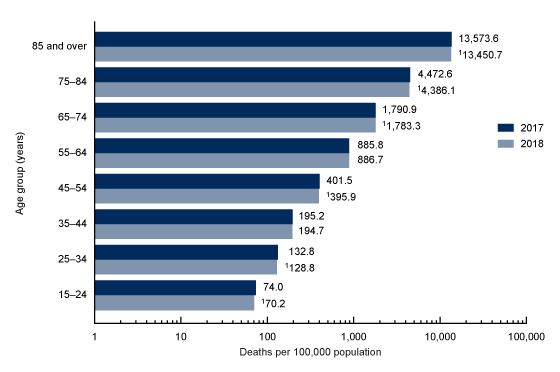
A population with a higher average age, like the vaccinated in this study, will have a higher mortality rate.
Is anything about that really controversial?
Face it, Berenson blew it here. If you're charitable you can say he's a very sloppy journalist. I'm a little more cynical.
People on the internet tell you all kinds of things. I advise you use your own judgment.
...I can see how people could get the impression that you are on the other side.
Defending blatantly misleading stuff like this Berenson piece is in no way conservative. Neither is advocating for the government to strip private property rights.
A point of view isn't necessarily conservative or on the right just because it's yours.
Bookmark
Comparing the populations of the vaccinated and unvaccinated from the UK dataset, we get this:
| Week Ending | Unvaccinated minus Vaccinated |
|---|---|
| 03/19/21 | 18,711,628 |
| 03/26/21 | 16,638,805 |
| 04/02/21 | 15,163,725 |
| 04/09/21 | 14,511,134 |
| 04/16/21 | 13,695,757 |
| 04/23/21 | 12,731,409 |
| 04/30/21 | 11,882,163 |
| 05/07/21 | 10,747,085 |
| 05/14/21 | 9,125,109 |
| 05/21/21 | 7,260,727 |
| 05/28/21 | 5,103,106 |
| 06/04/21 | 3,378,445 |
| 06/11/21 | 1,467,597 |
| 06/18/21 | -213,356 |
| 06/25/21 | -1,652,740 |
| 07/02/21 | -2,859,353 |
| 07/09/21 | -3,802,480 |
| 07/16/21 | -4,651,527 |
| 07/23/21 | -5,445,565 |
| 07/30/21 | -6,130,821 |
| 08/06/21 | -6,787,382 |
| 08/13/21 | -7,536,744 |
| 08/20/21 | -8,363,901 |
| 08/27/21 | -9,173,408 |
| 09/03/21 | -9,728,848 |
| 09/10/21 | -10,180,954 |
| 09/17/21 | -10,508,181 |
| 09/24/21 | -10,757,024 |
The unvaccinated population exceeded the vaccinated population until June 18, at which point they crossed. By the end of the dataset, the vaccinated population exceeded the unvaccinated population by the same amount that the unvaccinated exceeded the vaccinated on May 7.
So how do you explain the steadiness of the graph despite the flip-flop in population size?
How do you explain the data points on June 19 when the two populations were equal in size? Shouldn't the age factors have applied equally to both populations given that both populations were equal in size?
-PJ
Seriously?
It's a graph of the mortality rate per 100,000.
The absolute size of the populations is irrelevant.
What matters is demographic similarity, which is missing.
That is a crying shame. I hope and pray people will be held accountable on earth some day.
Talk about smearing the messenger!
That’s the last resort of people who can’t defeat the argument.
The other day I told someone that the German Health Minister said that by the end of the winter surge everyone in Germany will be vaccinated, recovered from covid, or dead.
And the person said, “Well, look who’s saying it! The German Health Minister!”
Wouldn't that mortality skew flip to the other population as that other population becomes the dominant one?
So where do we see the "mortality effect" flip in the chart at the top as the unvaccinated population decreases and the vaccinated population increases?
-PJ
Right, the proportion of "older people" is higher in the vaccinated population because there are zero "younger people", that is under 18, in that group while there are many in the unvaccinated group.
Wouldn't the number of "older people" be more in a population that is twice the size of the other, despite it being per capita?
The number would be greater but not the rate. That's what the per capita calculation is for.
Per capita income doesn't necessarily change as the population grows, does it?
So where do we see the "mortality effect" flip in the chart at the top as the unvaccinated population decreases and the vaccinated population increases?
Not sure how to say this again.
The size of the populations doesn't affect this calculation.
Out of every 100,000 vaccinated people how many died of a non-Covid cause?
Is it more or fewer than died in a demographically similar group of unvaccinated 100,000 people.
That's it. It doesn't matter how many total in each group there are, the rate calculation normalizes for that.
The problem here is one of the two populations is older on average, so naturally their mortality rate is higher.
Disclaimer: Opinions posted on Free Republic are those of the individual posters and do not necessarily represent the opinion of Free Republic or its management. All materials posted herein are protected by copyright law and the exemption for fair use of copyrighted works.