Posted on 08/14/2016 2:07:27 PM PDT by BigEdLB
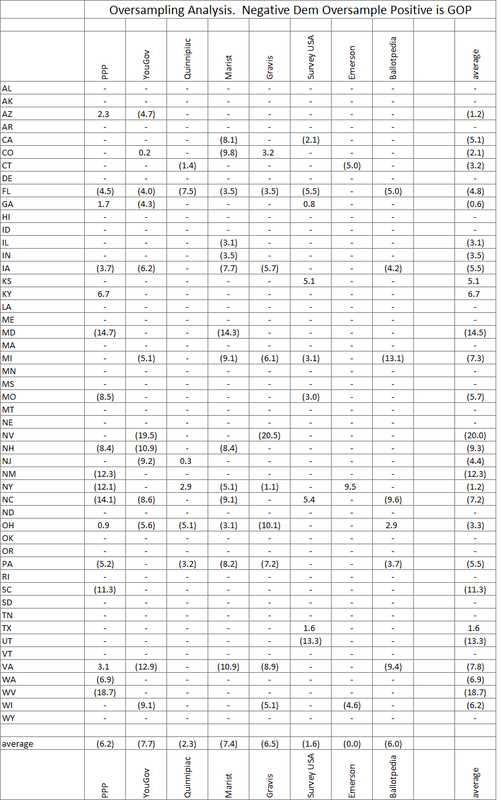
Here is my analysis of oversampling during polling vs Gallups analysis of that actual party ID in a state is. 
So what does this mean to the current Trump v. Clinton polling.
FYI
Interesting...
Bkmk
Political party voter registration varies from state to state and somewhere between 7 and 10 percent of registered Republicans will be Clinton voters (RINOs) and registered Democrats will be Trump voters (DINOs).
Check out this live ABC poll, no over sampling here. Trump is kicking her A**:
http://abcnewsgo.co/2016/08/abc-live-poll-who-are-you-voting-for/
What have the Russians read in her emails that we should know about Hillary’s health?
Oversample compared to ‘what’ please.
Census, turnout, exit polling... ?
I *believe* it to be the percentage more democrats than conservatives in the polling sample.
These are the oversample values for the most recent poll for a pollster in a state. Look at Florida (FL) a poll from PPP oversampled Dems 4.5 vs what Gallup said it should be. Yougov (Today BTW) 4.0, Quinnipiac 7.5, etc... Yougov today had Hillary +5, but with a dem oversample of 4.0, the outcome depends on the indepenndents because between D and R it is a dead heat. Hillary is +1 over Dem party ID difference. It is also dependent on turnout D vs R. It isn’t going to be D+6 like it was in 2012.
What data did the pollsters use to determine the number os registered voters for each party? Did they use last election numbers? or current numbers?
I assume that for many states, switching occurred, more Dem to Repub, than Repub to Dem.
Did your analysis count for this?
There is a youtbe video in English with Russian subtitles which shows coughing and epileptic headbobbing on oklasskani (sp) social network.
One thing was pointed out to me, a political non-expert, that I found somewhat interesting.
Take a state like CA (well, maybe there is no such state)
Nobody believes for a minute that HRC will not win CA and all of its 55 EVs. But when it comes to polling individuals which is the thing that is done to generate the poll numbers we hear of, giant numbers of those individual votes are wasted. Once a candidate achieves enough votes to win a district, county, state, any additional votes do not amplify nor enhance his/her numbers. It wouldn’t matter if HRC got every single vote in CA, and so, she could poll now today with a massive lead and win no more EVs than she would if only 51% voted for her/it. While there is of course nothing world-shaking nor new about this observation, it’s my thinking that we’re going to see a lot of this in the electoral count.
I used not registration numbrts, but self ID of party which is different and more an accurate gauge of how people ID themselves.
What’s the difference between figures within parentheses and not?
Gallup puts out an annual report of self ID by party. I used that to compare. It seems to be closer to results than the other more acive pollsters when it is used
Parenthesis, negative, i.e. Democrat Oversample. No parenthesis positive, Republican oversample.
“The share of independents in the public, which long ago surpassed the percentages of either Democrats or Republicans, continues to increase. Based on 2014 data, 39% identify as independents, 32% as Democrats and 23% as Republicans. This is the highest percentage of independents in more than 75 years of public opinion polling.”
http://www.people-press.org/2015/04/07/a-deep-dive-into-party-affiliation/
Good job Big Ed.
Disclaimer: Opinions posted on Free Republic are those of the individual posters and do not necessarily represent the opinion of Free Republic or its management. All materials posted herein are protected by copyright law and the exemption for fair use of copyrighted works.