Skip to comments.
Beneath the glow of stock-market records, darkly bearish trends are lurking
market watch ^
| Aug 7, 2017 8:07 a.m. ET
| Ryan Vlastelica
Posted on 08/07/2017 10:20:26 AM PDT by BenLurkin
Market breadth, a measure of how many stocks are rising versus the number that are dropping, has turned “exceedingly negative,” according to Brad Lamensdorf, a portfolio manager at Ranger Alternative Management. Lamensdorf writes the Lamensdorf Market Timing Report newsletter and runs the AdvisorShares Ranger Equity Bear ETF HDGE, -0.64% an exchange-traded fund that “shorts” stocks, or bets that they will fall.
“As the indexes continue to produce a series of higher highs, subsurface conditions are painting an entirely different picture,” Lamensdorf wrote in the latest edition of the newsletter. He noted that the year-to-date advance in equities — the S&P 500 SPX, +0.10% is up 10.6% in 2017 — has been driven by outsize gains in some of the market’s biggest names.
Most notably, the so-called FAANG stocks, which refers to a quintet of technology and internet names, have by themselves contributed more than 28% of the benchmark index’s gain. Separately, megacap names like Boeing Co. BA, +1.42% and Johnson & Johnson JNJ, -0.37% have also outperformed the broader market.
“The good performance of these large companies is masking the fact that many stocks, including REITs and those in the retail sector, have already entered bear-market territory,” Lamensdorf wrote, referring to real estate investment trusts.
According to an analysis of FactSet data, 79 components of the S&P 500 are trading at least 20% below their 52-week high; a bear market is typically defined as a 20% drop from a peak. However, more than half the components are in what could be deemed bull market territory — at least 20% above their 52-week low.
Lamensdorf also cited a measure that compares market volume on advancing days to volume on days when the major indexes decline.... since mid-2016, the spikes have topped out at progressively smaller highs.
(Excerpt) Read more at marketwatch.com ...
TOPICS: Business/Economy
KEYWORDS: aapl; amazon; amzn; apple; bubble; dow; faang; facebook; fb; googlegoog; netflix; nflx; stockmarket
What that pic at the link is supposed to represent -- I have no idea.
1
posted on
08/07/2017 10:20:26 AM PDT
by
BenLurkin
To: BenLurkin
dum, dum, DUUUUUUMMMMM!!!!!!
2
posted on
08/07/2017 10:22:33 AM PDT
by
FrdmLvr
("A is A. A thing is what it is." Ayn Rand)
To: BenLurkin
The bull is the mask. The bear is under the mask. I guess that is what they are trying to get from the picture.
3
posted on
08/07/2017 10:25:22 AM PDT
by
PJBankard
To: BenLurkin
The liberals, who own Market Watch are using fake news, still.
4
posted on
08/07/2017 10:29:55 AM PDT
by
Grampa Dave
(Voting for Trump to be our President, made 62+ million of us into Dumb Deplorable Colluders, MAGA!!!)
To: BenLurkin
People who own malls are turning in a crappy performance.....well DUH!
To: Grampa Dave
Lamendorff’s interpretation of the data may very well be skewed by his firms emphasis on short sales. True.
The best bet for any investor is to use the Lamendorff analysis as a jumping of point for making their own assessment of the information presented.
6
posted on
08/07/2017 10:35:57 AM PDT
by
BenLurkin
((The above is not a statement of fact. It is either satire or opinion. Or both.))
To: BenLurkin
If it’s written down or online it must be true.
7
posted on
08/07/2017 10:37:29 AM PDT
by
DIRTYSECRET
(urope. Why do they put up with this.)
To: BenLurkin
With 85% of corporate earnings reporting this quarter, and 75% of those
beating earnings (for the last two quarters), this article is anything but to bring Trump rally down.
To: BenLurkin
Utter nonsense. The market climbs a wall of worry.
9
posted on
08/07/2017 10:42:33 AM PDT
by
montag813
(ue)
To: wardamneagle
The earnings numbers are positive. True. A complete turn around for many companies which ere losing money or breaking close to even. Any investor looking to buy those stocks will want to take a very close look exactly how the current numbers were generated.
10
posted on
08/07/2017 10:49:41 AM PDT
by
BenLurkin
((The above is not a statement of fact. It is either satire or opinion. Or both.))
To: BenLurkin

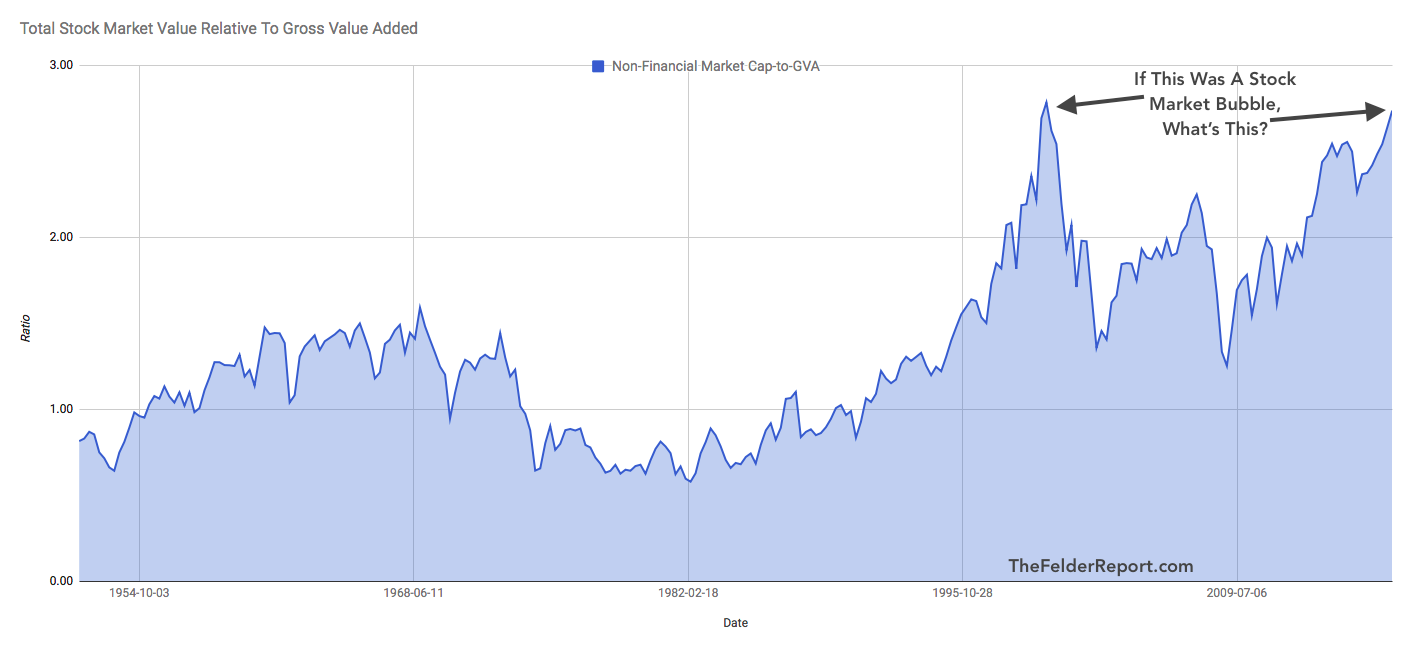
This chart shows what was what when the Dot-Com bubble was about to burst. I would plan accordingly, if you've not already done so. Diversity is your friend, when it comes to investments. If History is an indicator, at a minimum we're due for SOME sort of downward, 'adjustment' in the very near future. And oh, wouldn't the Socialists LOVE IT if it happened on Trump's Watch? ;)
11
posted on
08/07/2017 10:52:59 AM PDT
by
Diana in Wisconsin
(I don't have 'Hobbies.' I'm developing a robust Post-Apocalyptic skill set!)
To: All
12
posted on
08/07/2017 10:53:58 AM PDT
by
Diana in Wisconsin
(I don't have 'Hobbies.' I'm developing a robust Post-Apocalyptic skill set!)
To: Diana in Wisconsin
13
posted on
08/07/2017 11:20:54 AM PDT
by
BenLurkin
((The above is not a statement of fact. It is either satire or opinion. Or both.))
To: Diana in Wisconsin
https://thefelderreport.com/2017/08/02/by-this-measure-the-current-stock-market-bubble-is-far-bigger-than-the-dotcom-bubble/While that may be true we have to remember there is far more funny money circulating out in our economy than there was then. I'm not sure how that would adjust to the current condition but it's something to consider.
CGato
14
posted on
08/07/2017 11:30:56 AM PDT
by
Conservative Gato
(There are NOW 4 kind of LIES; Lies, Damned Lies, Statistics, and the Media.)
Disclaimer:
Opinions posted on Free Republic are those of the individual
posters and do not necessarily represent the opinion of Free Republic or its
management. All materials posted herein are protected by copyright law and the
exemption for fair use of copyrighted works.
FreeRepublic.com is powered by software copyright 2000-2008 John Robinson
