Posted on 01/12/2022 11:50:14 AM PST by blam
Today, I heard two local, small town radio DJs going on about rate hikes coming down the pike, and I thought wow here we are again with rate-hike-hysteria.
Eight years ago I posted an article, Interest Rates Cannot Rise, Here’s Why In that article I depicted my model, forecasting that interest rates would not and could not rise.
Now remember 2014 was the peak messaging period by the Fed and Wall Street gearing up for “rate normalization”. So to go on record stating that rate normalization was impossible, was a risky move. In fact, a friend, who is a friend of Tom Campbell, who at the time was the Dean of Berkeley’s Haas Business School, described a conversation the two of them had about my theory. In that conversation Tom had me pegged as a “half-baked-monkey”. And fair enough, because at the time “rate normalization” had become a household phrase. It was simply, a given.
But the model I built was simple and took debt service as a percent of GDP over history and found a fairly tight range, (2%, 5%). Debt service is a drag on economic output and is a function of interest rates and debt. Given the deteriorating independent parameters of debt and GDP, the 10 year rate (proxy for average rate on public debt) was rigidly constrained, at least if history was a guide. Here’s the model.
The blue line above represents the predictive model and it predicted that the 10 year could not possibly break 4%. It is now 8 years on and we know that the 10 year peaked in 2018, at around 3.25%. History proved smarter than the experts.
Fast forward to today and here we go again. I figured it was time to dust off the model and give it another look. The one issue I always had with the model in its original form was that it wasn’t dynamic enough. That is, it didn’t adjust for the deteriorating economic productivity, which reduces capacity for economic drag (i.e. interest rates). It means the model lacked a key gauge for drag or interest rate capacity.
Think of it in terms of towing a trailer. Imagine two trucks both hauling 6,000 lbs (i.e. drag) at 60 mph (i.e. output). From the outside they look the same. However, from inside the cockpits we see that one truck is running at 2,000 RPMs and the other is running at 7,000 RPMs. That is, one has additional drag capacity, whereas the other is at full capacity and burning much more fuel. The drag on both trucks is the same (6,000 lbs) and the output is the same (60 mph) but the truck at 2,000 RPMs has additional drag capacity meaning it could take on more weight while maintaining 60 mph output (it would simply increase RPMs). The truck at 7,000 RPMs is at max RPMs and could not take on additional drag without reducing output i.e. speed. Its drivetrain simply does not have the productivity for additional drag without giving up output.
In our economy interest rates are drag and GDP is output and those were covered in my original model. But I needed to improve the model to adjust for drag capacity i.e. drivetrain productivity. Here’s where I landed.
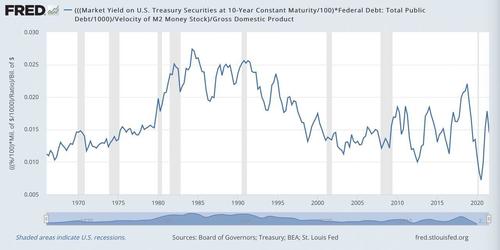
Money velocity is, in effect, the productivity of the economic drivetrain. It is a gauge of how efficiently or productively each dollar is used to generate output. It’s similar to RPMs in the above metaphor albeit in the inverse. The higher the velocity, the more capacity for additional drag given a fixed level of output. And so I updated my model by inserting M2 Velocity. Here’s what we get.
I take the the 10 year rate as a proxy for average rate on public debt multiplied by total public debt to give us our debt service. That’s our drag. But this needs to be adjusted by a factor of productivity to give us an “adjusted debt service”, and to do that I use M2 Velocity. Now we have our adjusted debt service over GDP.
What we find is an even tighter historic range than we had in the original model. The updated model range is (.9%, 2.74%) of GDP. That is an extremely tight range over a 60 year period with underlying parameters that have significant variance over time. Now we can solve algebraically for a max 10-year rate given various inputs of debt, GDP, and velocity.
Ok so what does all this mean?

In a nutshell, the 10-year rate cannot break 2.5%.
At 2.5% our adjusted debt service to GDP moves to 2.74%, matching the all time high in 1985. At that time, the economy had a very high capacity for drag and managed 13% rates due to a very productive drivetrain (low public debt and high velocity). Today we have the drivetrain of an ’83 Yugo with no drag capacity at all. In fact, today, in real terms, our economy is being pushed by negative drag. Even small adjustments to that negative drag will have enormous impacts on output.
In short, the Fed has no tools to add drag without a catastrophic reduction in output. And so inflation is a freight train hurling down an endless abyss with no brakes. Sir Hayek, was right.
“living in section 8 govt housing..not me”
About a dozen years ago a met a young woman looking for a Section 8 apartment. She had a list on her. Her available choices were often remarkably good.
“About a dozen years ago a met a young woman looking for a Section 8 apartment. She had a list on her. Her available choices were often remarkably good”
Yes many nice facilities. Do you want a gov’t inspector coming into your apartmnt every two weeks or monthly and telling you how to live or writing you up because you did not vacuum the floor?
“If I want equity, I buy real estate. If I want income secured by property, I loan on it.”
I want equity, but don’t care much for tenants, especially in addict-filled Florida, and especially after two years of government mandated free rent.
“If I want income secured by property, I loan on it.”
That’s great, unless BigStoreInc. is raising prices by 7% a year and people don’t want to pay more than 3.2% monthly on a mortgage. Taking a 3.8% battering in loss of buying power year after year isn’t to my tastes.
These crazy bastards are actually going to try to inflate their way out of a DEADLY debt bomb.
They are both insane and desperate.
Rates will remain far, far below the sanity threshold until everything vaporizes.
Borrow as much as they’ll let you have lol
“Yes many nice facilities. Do you want a gov’t inspector coming into your apartmnt every two weeks or monthly and telling you how to live or writing you up because you did not vacuum the floor?”
My friend in his affordable unit set-aside concierge building gets about 40 hours a week of government-paid help to mop and vacuum his floors, buy his groceries, cook his food, wash his clothes and wheel him and his wheelchair up to the roof deck for a good view of the US Capitol, etc.
Percentage-wise, no there are not. There are exceptions, back in the late ‘60s and early 70s my family built our own home. My parents never had a house payment on it. My sister and her husband built their own home from scratch but they’re billionaires so I don’t think that counts.
I’m talking about the general population.”Joe Sixpack, if you will.
Here is an extract from the Govs. own figures:
Title RPI All Items: Percentage change over 12 months: Jan 1987=100
CDID CZBH
Source dataset ID MM23
PreUnit
Unit %
Release date 15-12-2021
Next release 19 January 2022
Important notes
2019 JAN 2.5
2019 FEB 2.5
2019 MAR 2.4
2019 APR 3.0
2019 MAY 3.0
2019 JUN 2.9
2019 JUL 2.8
2019 AUG 2.6
2019 SEP 2.4
2019 OCT 2.1
2019 NOV 2.2
2019 DEC 2.2
2020 JAN 2.7
2020 FEB 2.5
2020 MAR 2.6
2020 APR 1.5
2020 MAY 1.0
2020 JUN 1.1
2020 JUL 1.6
2020 AUG 0.5
2020 SEP 1.1
2020 OCT 1.3
2020 NOV 0.9
2020 DEC 1.2
2021 JAN 1.4
2021 FEB 1.4
2021 MAR 1.5
2021 APR 2.9
2021 MAY 3.3
2021 JUN 3.9
2021 JUL 3.8
2021 AUG 4.8
2021 SEP 4.9
2021 OCT 6.0
2021 NOV 7.1
Disclaimer: Opinions posted on Free Republic are those of the individual posters and do not necessarily represent the opinion of Free Republic or its management. All materials posted herein are protected by copyright law and the exemption for fair use of copyrighted works.