Skip to comments.
"January Effect" an omen for 2015? --Investment & Finance Thread - Jan. 4
Weekly investment & finance thread ^
| Jan. 4, 2015
| Freeper Investors
Posted on 01/04/2015 9:26:15 AM PST by expat_panama
A good January for stocks promises big gains for the year --or so goes the story goes (from Down January for stocks is bad omen for 2014 - USA Today) "How stocks fare in January often sets the tone for the full year". A lot of work's been done on this, and TradingSim reports that
When the S&P500 has a net positive gain in the first five trading days of the year, there is about an 86% chance that the stock market will rise for the year, it has worked in 31 out of the last 36 years (as of 2006). The five exceptions to this rule were in 1966, 1973, 1990, 1994, and 2002. Four out of these five years were war related, while 1994 was a flat market. As history suggests, the markets average nearly 14% gains when the January Effect is triggered.
--but the downside is:
A down January is a bad omen for the stock market. Yale Hirsch of the The Stock Traders Almanac suggests that since 1950, every down January in the S&P500 preceded a new or extended bear market, or in some cases, a flat market. They go on to further suggest that down January’s are followed by substantial declines averaging -13%.
| |
|
|
|
|
|
| |
|
% above avg. months |
% times the following year is above avg. |
% times month predicts following year |
|
| |
|
|
|
|
|
| |
January |
55% |
66% |
59% |
|
| |
February |
48% |
66% |
55% |
|
| |
March |
60% |
66% |
56% |
|
| |
April |
53% |
62% |
55% |
|
| |
May |
47% |
63% |
60% |
|
| |
June |
44% |
62% |
53% |
|
| |
July |
57% |
63% |
55% |
|
| |
August |
59% |
62% |
55% |
|
| |
September |
38% |
62% |
49% |
|
| |
October |
51% |
66% |
51% |
|
| |
November |
56% |
62% |
57% |
|
| |
December |
67% |
64% |
58% |
|
| |
|
|
|
|
|
| |
average |
53% |
64% |
55% |
|
| |
|
|
|
|
|
That's nice, but let's do our own thinking.
On the left is what we get when we look at the Dow Jones average monthly change for each month since 1896 and compare the month's performance with the total returns for the subsequent 12 months. The idea is to see if January is any better at predicting the up comming year any better than say February or March or...
What we end up with is the fact that most months are up, most years are up so most months predict the following year. Since 1896 January has in fact predicted better than most, but our winner turns out to be May which is right 60% of the time vs. January's 59% score.
* * * * * * *
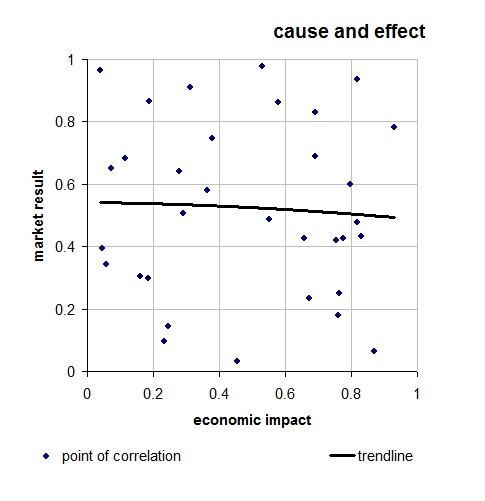
My personal take is that this is random and the problem we face is that it's sooo easy to see trends in purely random numbers. Check out the plot on the right of how an imaginary econ impact can affect my imaginary market. We end up with a trend line that slopes slightly downward. We could even exaggerate the scale and use it to "prove" a correlation.
My point is that all the numbers plotted there are random, and random numbers can always slow some kind of trend line. What's not random though is that people are productive and over the years they create wealth and if we invest in them we get rich. I can live with that.
TOPICS: Business/Economy; Government; News/Current Events
KEYWORDS: economy; financial; stockmarket; wallstreet
Navigation: use the links below to view more comments.
first previous 1-20 ... 41-60, 61-80, 81-100, 101-118 next last
To: expat_panama
@zerohedge
RIP knife catchers

To: Wyatt's Torch; All
http://www.wsj.com/articles/investors-pull-26-7-billion-from-pimco-funds-in-december-1420565180?mod=WSJ_hp_LEFTWhatsNewsCollection
Investors Pull $26.7 Billion From Pimco Funds in December - Morningstar
Pimco Had Outflows of $150 Billion From Its Mutual Funds in 2014
By Kirsten Grind
Jan. 6, 2015 12:26 p.m. ET
Investors pulled a net $150 billion from Pacific Investment Management Co.’s mutual funds in 2014, the largest annual exodus ever experienced by a mutual fund firm, according to preliminary figures Tuesday from fund research firm Morningstar Inc.
In the final month of the year clients withdrew $26.7 billion, including about $18 billion from Pimco’s flagship Total Return fund. That figure differs slightly from the $19.4 billion in December withdrawals from Total Return that Pimco disclosed Friday because of the way assets are counted.
62
posted on
01/06/2015 2:33:41 PM PST
by
abb
("News reporting is too important to be left to the journalists." Walter Abbott (1950 -))
To: citizen
past and current FED policy, commonly referred to as a zero interest rate.After looking over and guessing what your point is I'd say we're 100% together. There's a ton of details we're not together on but they don't really matter as much as the fact that there's such a huge list of things wrong w/ the U.S. economy. Something we might get clearer on is the fact that economies have good times and bad times, and they also expand and contract. We need to understand that expand/contract does not mean good/bad. Peak good times is when the contraction begins. The contraction continues until things are super bad and that's when the expansion begins.
The problem we got now is that the economy is bad and it's been expanding for several years. The reason the healing has taken so long is becuase of all the tax'n'spending. The goofy left wants us to think it's the Fed's fault. It isn't; all that stuff the Fed's been doing is a side issue. The problem is tax'n'spending.
To: Wyatt's Torch
http://www.wsj.com/articles/oil-prices-fall-slightly-in-asian-trading-1420609392?mod=WSJ_hp_LEFTTopStories#livefyre-comment
Oil Prices Fall Further
Brent Crude Falls Below $50 a Barrel
By Tommy Stubbington and Eric Yep
Updated Jan. 7, 2015 3:25 a.m. ET
Oil prices fell further on Wednesday, with the Brent crude benchmark falling below $50 a barrel for the first time since 2009.
Brent futures dropped by more than 2% to $49.92 a barrel on London’s ICE Futures Exchange in early European trade. At last year’s peak in June, Brent traded at more than $115.
Wednesday’s decline is the latest landmark in a six-month long selloff spurred by growing production in the U.S. and fears that a slowdown in global growth will crimp demand.
Some weak U.S. service sector and manufactured goods reports on Tuesday added to those concerns.
“The impact from weak data in the U.S. seems to have added to concerns of falling oil prices and slowing global activity,” analysts at Barclays said.
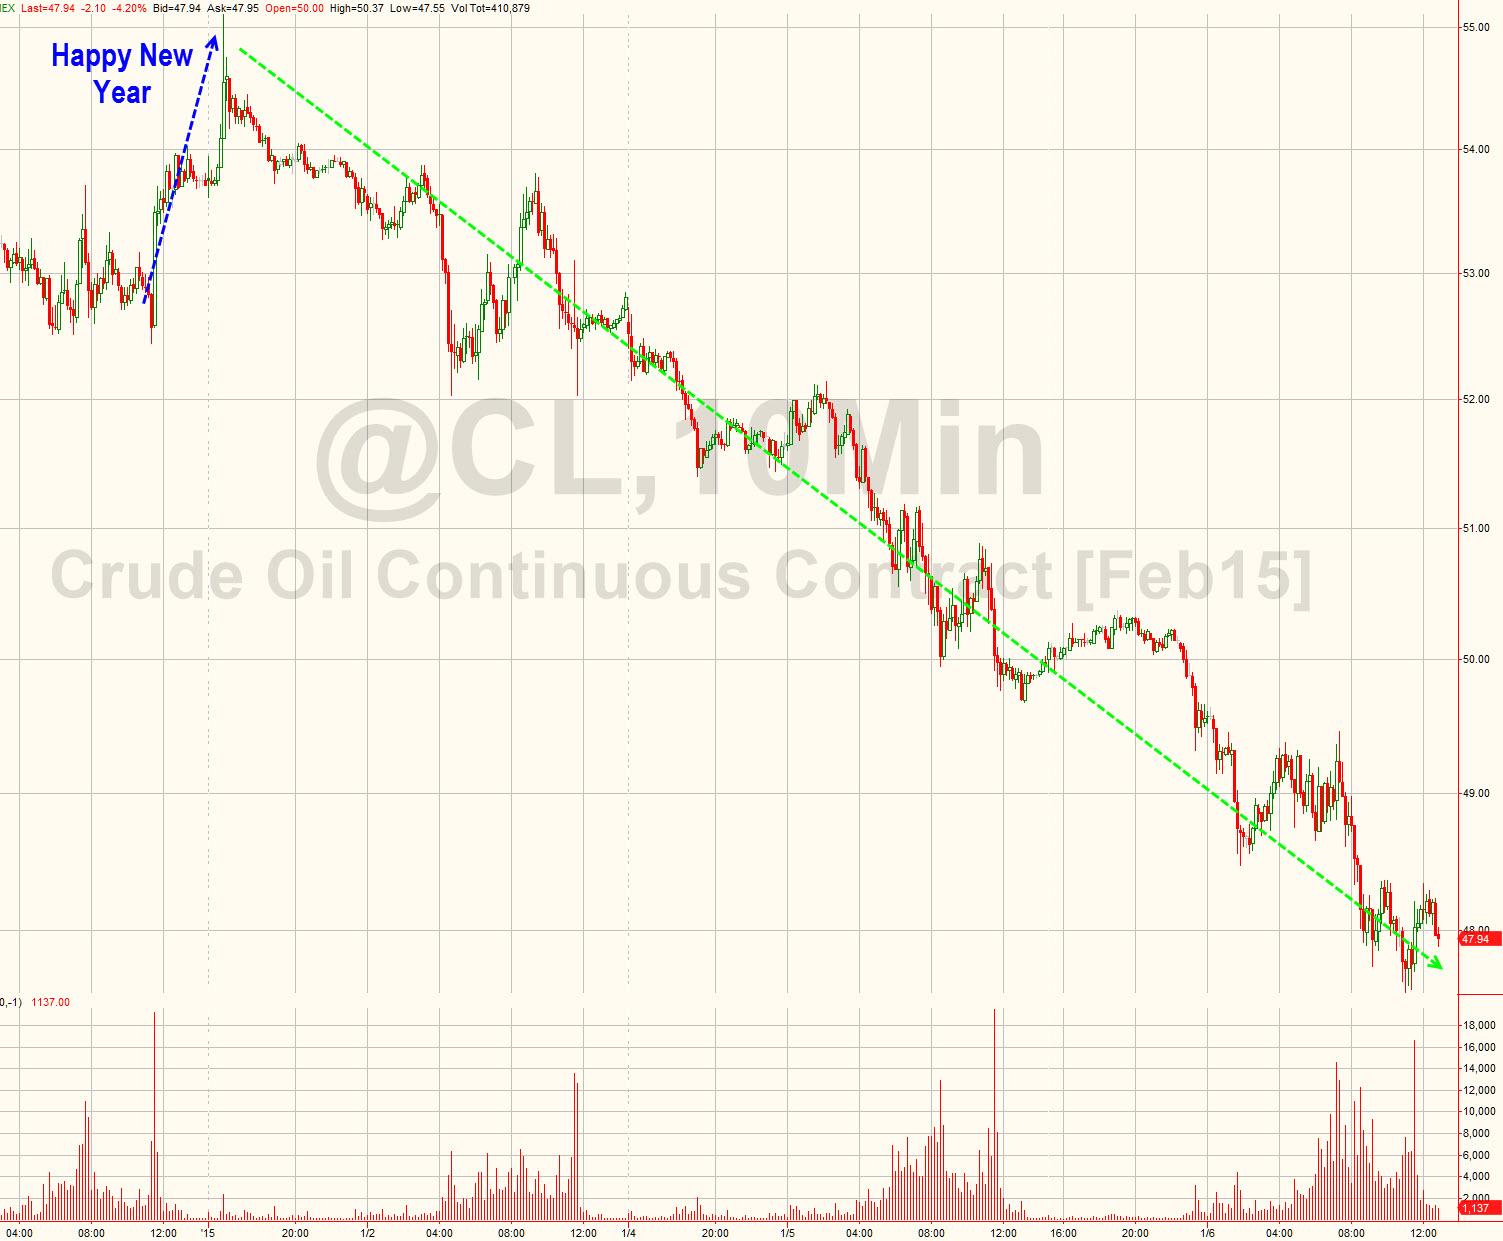
On the New York Mercantile Exchange, light, sweet crude futures for delivery in February recently traded at $47.88 a barrel, down $0.05 in the Globex electronic session.
The last time Brent crude settled below $50 a barrel was in April 2009. The global oil benchmark is down by about 11% so far this year.
While the current price rout has been driven mainly by oversupply, as Middle Eastern producers fight for market share with U.S. shale companies, it has raised concerns that demand itself may take a big hit this year.
snip
64
posted on
01/07/2015 2:39:17 AM PST
by
abb
("News reporting is too important to be left to the journalists." Walter Abbott (1950 -))
To: sparklite2
“The only thing real is “real” estate. And they aren’t making any more.”
Yeah - they were saying that in 2007 too. “They aren’t making any more - the price will only go up!”
65
posted on
01/07/2015 2:46:49 AM PST
by
21twelve
(http://www.freerepublic.com/focus/f-news/2185147/posts 2013 is 1933 REBORN)
To: Wyatt's Torch
In my Costco magazine they had a story on organic chickens raised on open farms. It had a photo of a idyllic barn yard area with some structures, sun, shade, grass, etc.
A few birds were standing alone - looking for food I suppose. The rest were in about 3-4 groups with about 8-10 birds all clumped together - on top of each other, etc. Some in shade, some in sun, etc. (And all the room in the world around them.)
I can just see these poor chickens in California in their separate cages thinking “but we LIKE to all be together!”
66
posted on
01/07/2015 2:54:34 AM PST
by
21twelve
(http://www.freerepublic.com/focus/f-news/2185147/posts 2013 is 1933 REBORN)
To: abb
I don’t buy the “oversupply” argument. It’s not as if all of a sudden there was a huge change in production in September... Everyone has seen the chart of US production growing exponentially for the last three years. Sure some of the “oversupply” has an impact but not to cause a price collapse of over 50%. That just fails basic math.
The other major piece is the ROW falling apart. The U.S. remains strong (relatively) but will we be dragged down with them?
How much of this is short covering?
Seems we might be nearing a bottom as the fundamentals just don’t support a 50% sustained decline. Now the climb back up might be long. But I’m looking at some companies who are off 60-70% and think they might be good deals.
To: Wyatt's Torch
One would have to surmise that the oversupply was the catalyst. Without that first, none of the other stuff happens. But the history of the biz is littered with boom/bust ever since. Spindletop, East Texas, Middle East, and on and on.
One commentator yesterday suggested that market speculation acted to drive the prices far and fast, perhaps lower than the fundamentals warrant.
Such is the nature of markets.
68
posted on
01/07/2015 4:10:54 AM PST
by
abb
("News reporting is too important to be left to the journalists." Walter Abbott (1950 -))
To: abb; Wyatt's Torch
69
posted on
01/07/2015 4:28:50 AM PST
by
Lurkina.n.Learnin
(It's a shame nobama truly doesn't care about any of this. Our country, our future, he doesn't care)
To: 1010RD; A Cyrenian; abb; Abigail Adams; abigail2; AK_47_7.62x39; Aliska; aposiopetic; Aquamarine; ..

Top o' the mornin' to all! Another super busy day but this time w/ futures tanking metals (-0.62%) and soaring stock indexes (+0.67%). Making up for yesterday's stock plunge in astronomical volume beside gold'n'silver leaping to $1,214.85 and $16.52. Energy stocks slopped another -1.47% --almost as bad as financials at -1.53%. Anyway today's action will be stirred up even more this morning w/ these announcements:
MBA Mortgage Index
ADP Employment Change
Trade Balance
Crude Inventories
FOMC Minutes
Other headlines:
To: expat_panama
I read that “•The Myth About TARP’s $15 Billion Profit”. The one thing that bothers me about the line that “the taxpayers” have been paid back is although the companies that benefited payed the gov’t back how much of that just went into a slush fund that has been spent on all sorts of gov’t wet dreams but the taxpayer is still on the hook for the funds.
71
posted on
01/07/2015 5:54:26 AM PST
by
Lurkina.n.Learnin
(It's a shame nobama truly doesn't care about any of this. Our country, our future, he doesn't care)
To: expat_panama
December ADP National Employment Report (NER) revealed a gain in private sector payrolls of +241,000 following a revised increase of +227,000 for November (previously +208,000).
To: Lurkina.n.Learnin
I would be proper to separate Paulson/Bernanke/Geithner TARP from Pelosi/Reid/Frank TARP... The former has all been paid back by the banks. The latter was the porked up politician version.
To: expat_panama
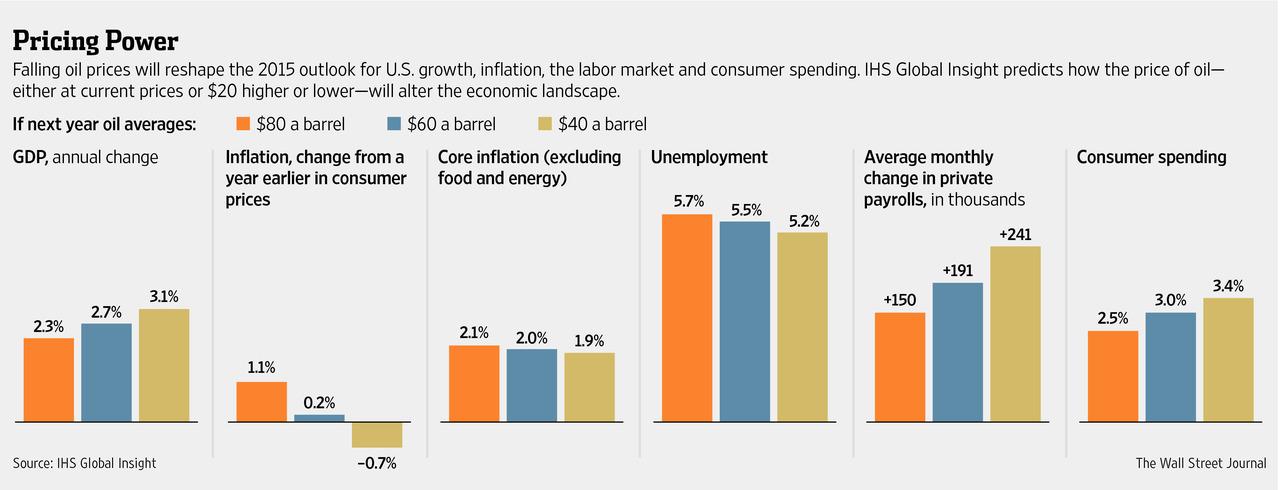
Good chart from the WSJ today on the impact of oil on everything:

To: Lurkina.n.Learnin
...although the companies that benefited payed the gov’t back how much of that just went into a slush fund...We're only talking here about TARP, not what happened after.
What we know about TARP is that not only was all TARP money paid back but in addition $15 billion was also paid by the companies to the federal treasury. The writer wants to complain about the evil capitalist bankers whom we all want to hate and kill and how they bilked the poor poor government that we all love and adore. So the writer lies and says in the title that the $15 billion paid by the capitalist exploiters was just a myth and never really happened. Then he admits that the $15 billion profit actually did get paid but it wasn't enough so being not enough means it was a myth.
Bottom line here, TARP got all paid back, it cut a $15B profit, the writer is a lying Marxist.
To: expat_panama
To: Wyatt's Torch
Good chart from the WSJ...What makes it good is that the forecast is based on what's happened every time in the past ---not on the pop craving for more doom'n'gloom.
To: Wyatt's Torch
separate Paulson/Bernanke/Geithner TARP from TARP...The TARP was '08 Bernanke but what Pelosi/Reid/Frank/Obama called their thingee was 'economic stimulus'. imho confusing the two is stupidly mindless even though it's what almost everyone does. Every time I hear Rush mix 'em up I switch to Prager.
To: expat_panama
There was that (ARRA - stimulus) too but TARp was also porked up by the politicians. The original bill was <10 pages and by the time it was done going through Congress it was several hundred pages.
To: Wyatt's Torch
http://finance.yahoo.com/news/why-hard-pick-oils-bottom-034857980.html
Why it’s so hard to pick oil’s bottom
CNBC By Leslie Shaffer
Trying to pick the bottom of oil’s surprise price plunge may be tougher this time around, with analysts turning to non-traditional indicators to make predictions.
“Normally, when you have a collapse in a commodity price, it’s in response to some supply demand shock,” Mark Keenan, a cross-commodity strategist at Societe Generale, told CNBC. “[But] you’ve actually had a change in the supply and demand curve so you can’t really apply traditional shock dynamics.”
Like many analysts, he expects oil will fall further, citing a host of bearish supply news, such as expectations the U.S. will export more of its oil and record production levels from Iraq and Russia.
Just this week, global oil prices have dropped almost 10 percent amid mounting worries about a supply glut. U.S. crude closed at $47.93 per barrel Tuesday, the lowest settlement since April 2009, down $2.11 on the day. Benchmark Brent crude fell to a session low of $50.55 a barrel, its lowest since May 2009, in late afternoon trade Tuesday in the U.S., down more than 55 percent from its mid-June level.
One tool Keenan is watching is trade in put options — or contracts giving the buyer the option to sell assets at a particular price by a set date.
“In the wake of this recent price fall, they’ve been quite accurate lead indicators of where prices are going to go,” he said, noting many puts are being bought on Brent at $40.
“Option positions established in Brent tend to be more purposeful and done by quite sophisticated investors because its slightly less liquid and so quite revealing sometimes of where we’re going to go,” he said.
Beyond that, he’s looking to less obvious indicators, such as U.S. employment data, broken down into sectors such as pipeline production, oil extraction and oil services.
“If we start to see changes in these profiles, that would be suggestive certainly that these companies are looking to rein in production and production growth is going to slow,” he said.
Keenan’s also looking to U.S. railcar traffic, as shale oil tends to be produced in land-locked regions, away from main pipelines and is often transported by rail. He also is looking to oil-drilling rig counts and production per rig.
80
posted on
01/07/2015 7:59:12 AM PST
by
abb
("News reporting is too important to be left to the journalists." Walter Abbott (1950 -))
Navigation: use the links below to view more comments.
first previous 1-20 ... 41-60, 61-80, 81-100, 101-118 next last
Disclaimer:
Opinions posted on Free Republic are those of the individual
posters and do not necessarily represent the opinion of Free Republic or its
management. All materials posted herein are protected by copyright law and the
exemption for fair use of copyrighted works.
FreeRepublic.com is powered by software copyright 2000-2008 John Robinson
 predict the following year. Since 1896 January has in fact predicted better than most, but our winner turns out to be May which is right 60% of the time vs. January's 59% score.


