
Posted on 07/21/2020 2:37:11 AM PDT by DoughtyOne
PING LIST - Please contact me as needed...
COVID-19 Update # 125
As of 07/20/2020 23:15 PDST United States CDC - Provisional Numbers
As of 00/00/2020 23:45 PDST Johns Hopkins University - Capture Nations Informaton
As of 00/00/2020 23:45 PDST Johns Hopkins University - Capture Counties Information
As of 00/00/2020 23:46 PDST Johns Hopkins University - Process JHU Data
As of 00/00/2020 23:59 PDST WorldofMeters - Document Core Numbers
As of 00/00/2020 23:59 PDST WorldofMeters - Capture Nations Information
As of 00/00/2020 23:59 PDST WorldofMeters - Capture States Information
As of 00/00/2020 00:00 PDST WorldofMeters - Data Processing begins...
As of 00/00/2020 ??:?? PDST Publish COVID-19 Update - 00/00/00
Thank you for stopping by to check out the COVID-19 Update.
Here you can find...
Section: 01 Commentary, Special Reports, COVID-19 Update Info, & System Notes
Section: 02 the United States Situation
Section: 03 the Global Community Situation Outside China
Section: 04 the Global Community Situation Including China with reservations
Section: 05 the Mortality Report
Section: 06 Miscellaneous Reports of Interest
Section: 07 the United States, Counties (alphabetical / case no descending)
Section: 08 the United States, States Ranking, Provisional Numbers, & Territories
Section: 09 the United States, Ranked with Other Nations
Section: 10 the End of this COVID-19 Update
Section: 11 Data Sources and a Link to My Own Spreadsheet
Section: 12 Linked Spreadsheet: Counties, States, Provisional, Territories, & Nations
Section: 13 Links to Other Resources
Section: 01
Commentary, Special Reports, and COVID-19 Update Information1
Interesting Tid-bits (hopefully)
Overview of Fatalities
Yesterday's Fatalities were moderate by recent standards. At 546 they were still
17.42% over the total for the same day last week. We've been running about 10.0%
over the same day the privious week for a short period of time now. If that
continues, it doesn't bode well for us staying below the 1,000 Fatalities per day
mark.
Another Issue with Testing Postives...
Recently folks have focused on the people who have to retest until they are deemed
all clear in order to go back to work. some folks are presuming each test is
recorded as a positive test and a defacto new case, until they get the all clear.
I don't honestly know they aren't retested and considered an already active case.
That may be the case. Then again, maybe not.
I urge folks to look at the numbers, read up on situations like this and realize
what you are looking at is the best anyone can produce right now in the way of
numbers. If there were something more credible, I would bring it to you. We're
stuck with this until something better comes along. Either that or we just give up
trying to keep tabs on what is going on. Just remember that this data that may not
mean exactly what it seems to indicate.
I consider the folks who come to this presentation each morning, to be capable of
understanding the swirling claims made by those who want to dismiss all numbers
associated with Cases and Fatalities.
It's very hard to take some of these claims seriously. One Example, the other day it
was claimed that only postivve cases were being reported in many Florida testing
centers. That sounded pretty bad on the face of it, so I decided to verify
the positve percentage of Florida's Declared cases to the total test that have been
given.
Think, if all that were being reported out were postives, that would mean that the
percentage of postives to tests given would have to be nearly 100%. What I found
though, was that Florida's Declared Cases to testing turned out to be in the
11.0% range.
Think, does anyone really put a figure on negative tests? Why would you need to?
If you give 1,000 tests, and 100 are postives, that's 10.0%. Would anyone actually
report out 90% were tests that resulted in a negative? Of course not. What is
kicked out is tests given and positives. A few seconds and the negatives could
be calculated, but they would never be reported. The 11.0% figure makes it clear
this is what was going on. At least it does to my thinking.
IMO < too many people are over-thinking these numbers. If the media we loathe
comes up with some sensational story, it's amazing how some folks gobble it up
as being absolutely the truth. Folks, this is still the enemedia. They are still
pumping out sensationalism to create chaos.
Folks, I've never heralded the testing negatives here. I had alwys thought folks
were smart enough to realize all the tests given minus the posities would be the
the level of negatives. Maybe I was too optimistic.

Section: 02
The Following Addresses the Numbers Here in
the United Staetes of America
Here we go...

New Cases dropped off yesterday roughly the same amount as they had risen the day
before. It should be noted, that Resolved Cases have now slipped over the 50.0%
mark for all cases we have declared since the start of the COVID-19 situation.
Concept of adding in Active Cases and Serious Critical here, courtesy of amorphous
Here are more of our numbers...

Our Active Cases are still growing due to all the positive testing, and a higher
level of positives being found.
Our Slice of the COVID-19 Pie
The growth of our slice of the pie has been increasing recently.
Here are the numbers I've been tracking, Globally Declared and Active Cases.

More minimalist growth here,... but over time it adds up.
Active Cases in the United States / Chart
Unlike some of the other charts here, we should see a good rise and
fall at some point withone.
Note that this presents the single, seven, and fourteen day averaging versions.

Remember, these are not new Declared Cases. These are remaing Active Cases.
Clearly the single, seven, and fourteen day lines are moving way up.
Testing and New Case Figures
Requested by stocksthatgoup
Some folks have shown an interest in seeing the COVID-19 Test figures compared
to the New Cases being declared. The following Data addresses that.

Yesterday things reversed compared to the day before. Test went up and the
percentage of positives went down.

As I've mentioned before, the Positive Percentage bounces around a lot. I'm not
sure that causes me to trust this information much. You can't tell me the
Postive Percentage actually goes down a full 1.833% one day and back up 2.40% the
next. A cross section of people should remain rather constant, going up or down
minimally as the trend changes. Logically, at least to me, with that many
tests, the Postive Percentage should only change 0.25 - 0.50% per day at most.
Maybe I am missing something.
The U. S. Stats / w 10 Day Averaging / Fr: 03/17
Requested by: Texas Eagle
This data and chart presents things in a little different way. In the
chart it is easy to see the relationship of these numbers.
The Chart will use the data all the way back to 03/17, but the data displayed
here will only go back one month.

Here is the chart to match.

The Active Cases and Resolved Cases are now coming very close. It's interesting
to compare this chart to the Global one.
Section: 03
The Following Addresses the Global Numbers
without Mainland China
Here is the first set of Data for the Global Outside China
Territories

Numbers still remain very high both on the domestic and international scenes.
Fata.lities, Recoveries, Resolved, Active Cases, and
Serious/Critical Cases - Globally, Excluding M/L China
Concept of adding in Active Cases and
Serious/Critical here, courtesy of amorphous
Here we go...

For your review...
How is the Global Community Outside China Doing,
Without U. S. numbers?
Let's see...

Numbers have fallon off here, but it was related to the day of the week. We'll
see growth again over the next few days.

It's pretty clear the New Case declarations are a lot heavier than they were a
few weeks back. Still,... the important thing to watch is the level of Fatalities.


These charts are now not only seeing growth internationally, but domestically
as well.
. The Active Cases outside China Globally / Chart
As in the U. S. version of this, we should see a good rise and fall at
some point these two.
Note that these present the one day and then 7 and 14 day averaging versions.


Remember, these are not new declared Cases. These are remaing active cases.
Special Section on France, Germany, Italy, Spain, and the U. K.
Case growth.
Jim Noble mentioned he'd like to see the US numbers added here. I added them
in on 06/21/2020. I did not add them to the chart because it would have
dwarfed the European nations chart lines. (they would have been reduced to
about 15% of their normal size)
Let's Look at Some Numbers in Five Day Increments:


The U. K. line there is quite similar to France's line over a month ago. These
nations that can't manage their data rationally are a menace. Smile..,
Sweden and It's Neighbors, Who Has the Best Tactic Against COVID-19?
Sweden is doing its own thing with regard to isolating. I think most people
are aware of it by now.
Here are some numbers to help us look at this issue.


At long last, Sweden's New Cases seem to be flatening out. Hopefully that will
be reflected in their Fatalities.
Movers and Shakers...
I will present the top fifty nations with the most New Cases and New
Fatilities.
Here we go...

Fatalities remained in the recent lower range again. The high reported
days ae just ahead.
Global osChina Stats / w 10 Day Averaging / Fr: 03/05
Requested by: Texas Eagle
This data and chart presents things in a little different way. In the
chart it is easy to see the relationship of these numbers.
The Chart will use the data all the way back to 03/05, but the data
displayed here will only go back one month.

Here is the chart to match.

I like being able to follow the movement of these stats visually.
Section: 04
The Following Addresses the Global Numbers
including Mainland China*
Mainland China's numbers are 0.005% of today's total global numbers.
A Look at Declared, Resolved<, and Active Cases, Includes M/L China
End of day figures follow:

I was a little surprised to see this over 63.00%. I had resigned myself to the
idea we weren't going to go up much higher right now. Wrong... We're now
knocking on 64.0 percents door.
Fatalities, Recoveries, Resolved, Active, and Serious/Critical
Cases Globally, Including M/L China
Concept of adding in Active Cases and
Serious/Critical here, courtesy of amorphous

For your review...
Section: 05
the Mortality Report
Here is the data for four entities...
Here are the figures for the growing case totals for four entities.

We hear all sorts of stories about how these figures are wildly off. The CDC
has studied them and seems to think they may actually be on the low side of
things. I am providing the CDC Provential Numbers down below. Not sure if
anyone has a rock solid number. I doubt it is possible. This is what is
reported out by WoM and JHU. Check out the CDC numbers too.

Charts like this one only show growth. That's why I recently took the advice
of a FReeper and added in a new chart for the U. S. and Global outside China
regions.
Here are figures revealing the daily growth for those four entities.

U. S. Fatalities for the day remained below 1,000. I'm not seeing the strength
to grow numbers here I was seeing a week or so ago. Numbers rose yesterday
remaining far below the 1,000 level.


Since the beginning of COVID-19's activity in the U. S., higher New Cases were
soon followed by elevated Fatalities. If we have gone to school on the data
of this disease, we know who should avoid exposure the most. So if the
demographic that has little to fear from the disease is out there getting
infected, it may not be a bad thing at all. If the Fatalities remain low,
vastly higher cases may simply increase the rapidity of the saturation of the
people in public who have already fought it off. And that may facilitate the
end of the disease. I'm sure others know this, but I did want to explain why
my thinking has fluctuated over time regarding these dynamics.
Here, let's look at data for the U. S. broken out by itself.

In the lasts 43 days, we have looked very good in this area. I'm not sure we've
had more than one clean count day over 1,000 in those 43 days, but a few days ago
we did. Since then we dropped back down to remain under that benchmark.

New York, New Jersey, I'm sure you'll have a very hard time figuring out where
they botched things... /s We had a little mini-event just after New Jersey also.
Section: 06
Population Saturation
Here are figures revealing how many people in each population base represent one
case. I'm also showing what percent of each population base is infected at this
time.

If you'll note, we just passed the half a percentage point of our populace's
infection rate. Looks like we're going to slip right by the 0.60% level if
momentum doesn't change.
Nations With Lots of Cases
At the end of the day yesterday, there were:

It's hard to belive there are that many nations with 1,000 cases.
Daily Case Report Evaluation
I'll be keeping tabs on the daily tallies for days of the week for a while. Folks have
noticed some patterns of larger and smaller data entry on certain days, and on Fridays
sometimes the numbers get noticeably larger because of it.
And we now know Thursdays have potential to break out also. Yikes!
IMO Let's check out the numbers and a chart.


Check out the growth over the last three weeks. Wow...
What's it going to look like in another three weeks?
Still, it's the Fatalities that count.
Section: 07
The Top 200 Counties in the U. S., by Number of Cases
This little report lists 200 Counties in the United States in declining Case numbers.
There is also a listing that is alphabetical. This report list only the entities
and the number of Cases in the two different sorts.
It will also be available as a downloadable Excel file in Section 12.

Section: 08
States of the Union and the District of Columbia, Compared to Each Other
Each of these pages is sorted differently. Look at the red header above
the columns to see which column was used for the sort on any given page.

For your review...

For your review...

For your review...

For your review...

For your review...

For your review...

For your review...

For your review...

For your review...
If this area interests you, please use this LINK to the source, and review
the lengthy description and explanation of it's development process.
There are two reports. The presentation above comes from the second one,
and the detailed segmented information below it, may interest you.

These can now also be found under the states on the Alphabetical list. The
states and these entity's numbers should be combined to match that of the
U. S. figures each day.
Section: 09
The United States, Where it Ranks With Other Nations?
Each of these pages is sorted differently. Look at the red header above
the columns to see which column was used for the sort on any given page.
The U. S. will be highlighted red here so we can find it easily in the list.
There was 215 nations on this list last night now. I didn't want to post
seven lists with 215 nations on it, so I picked the top 50. Coincidentally,
one report category had the U. S. at 41st, so it wasn't showing up on the
list with the 31 top nations on it. That wasn't the reason why I extended the
list length, but it did work out well.
I work on the nations right next to the states on my spreadsheet. The
states with the District of Columbia come in at a total of 51 lines.
I decided to keep the international reports near that length, and 50
was good enough.
Here we go... for your review.

For your review...

For your review...

For your review...

For your review...

For your review...

Around 06/23, China started putting out it's testing numbers. I thought
they were suspect. The number they put out was 90,410,000. Ours and most
everyone else's numbers are specific. For instance on 06/28, our number of
of tests at the ned of the day was 32,592,368. That specificity separates it
from the number China put out. It was rounded to the 10 thousandth place. In
addition, China has not updated that number once. So I do not inlude China in
the Nation's Comparison Sort regarding Testing, and any place that reports out
global testing numbers for a top level comparison.

We slipped to 24th place yesterday.
Progress...
Section: 10
Here is what it is all about. From January 20th to the present.

This concludes our look back at yesterday's data. Take care...

Section: 11
Data for this Report Sourced From:
LINK WorldoMeters
LINK Johns Hopkins University
The Center for Systems Science and Engineering (CSSE)
LINK United States Center for Disease Control - Provisional Numbers
Listed in the order of current utilization...
LINK You are Invited to Review My COVID-19 Spreadsheet (XLSX)
There is not an XLS version available for distribution at this time.
Section: 12
Other Features:
LINK US Counties200, States & DC51, Territories & Other Entities11, Nations219,
and the CDC Provisional Counts53
Five Excel Spreadsheet datasets you can sort for your own studies...
Section: 13
Links to other resources:
I cannot vouch for these sites. Please use your own judgement.
LINK Adventist Health Coronavirus Resource Hub - Scroll down for useful info
LINK Antibiotic Vitamin, the (Vitamin D)
Good article on Vitamin D's likely role in prevention of infection. Thanks Blam.
LINK CDC Data for Download - Scroll down - Excel required. Includes death stats.
LINK CDC National Center for Health Services
Provisional deaths as determined by review of vital documents. Much lower...
LINK CDC Secondary Data and Statistics - Portal Entry / Look around
LINK Coronavirus (COVID-19) Map
LINK Coronavirus infection risk may be reduced by Vitamin D
by Former CDC Chief Dr. Tom Frieden
LINK Coronavirus Spread Quickly Around the World in Late 2019, Study Shows
the University College London Genetics Institute
LINK COVID-19 Deaths Broken Out by Thirds, 05/07/20 Map of US Counties
Very revealing display of Concentrated Death Zones - thanks hoosiermama
LINK COVID-19 First U.S. Case, Treatment, features Remdesivir
New England Journal of Medicine article
LINK Cytokine Storm, med Actemra, Physician near death saved
LINK Diamond Princess Review at 634 Case Point of Eventual 712
LINK Hydroxychloroquine Article: International Poll
Daily Mail Reports, Most Effective Treatment According to 6,000 Physicians
LINK Hydroxychloroquine Has about 90 Percent Chance of Helping COVID-19 Patients
the Association of American Physicians and Surgeons, reports 91.6% of patients improved clinically
LINK IHME - Institute for Health Matrix and Evaluation
LINK National Institutes of Health - Cornavirus (COVID-19)
LINK Nasal Irrigation is the Key, COVID-19 Related
LINK New York City - interesting breakdown, borough, age, sex
LINK On the Origin of CCP Virus, A Documentary Movie (turn up the sound)
Epoch Times: I highly recommend this very well documented report.
LINK Rt COVID-19
Calculates and displays the Rt Factor for each state. Thanks FreedomPoster.
LINK World Health Organization

Just my opinion of course - but with the wide spread testing so far and the increase in positive cases shows the virus is now running wide in the general (healthy and younger) population.
Back in April we were running 30K +/- new cases a day with 2K +/- deaths per day. Lots of those deaths were in congregate living facilities.
Now we’ve been running 50k +/- new cases a day for the last 3 weeks (last 2 weeks over 60k +/-) with deaths per day 1k or under.
It ain’t over yet - but the time for panic is over.
Just my opinion of course.
“”” I had alwys thought folks
were smart enough to realize all the tests given minus the posities would be the
the level of negatives.”””
That presumes ‘all tests given’ is an accurate number.
I agree the numbers from WOM are the best we have for the overall view.
On May 19th and May 20th there were two data dumps of negative test results reported by the labs to FL Dept of Health.
Prior to these two days, Florida had reported about 30,000 tests per day. On May 19th they reported 77,934 tests and on May 20th they reported 53,413 tests. About 60,000 negative test results from prior weeks were thus reported.
I agree the time for panic is over, but they are preparing the next spike out of D.C. by 1,000 buses on August 28 for the MLKjr/BLM rally, where distancing will be optional. This spike will spread with buses returning to their sources to spread more illness throughout the country, and will probably last until the election.
Recently folks have focused on the people who have to retest until they are deemed all clear in order to go back to work. some folks are presuming each test is recorded as a positive test and a defacto new case, until they get the all clear. I don't honestly know they aren't retested and considered an already active case. That may be the case. Then again, maybe not.
Some of the testing statistics I have looked at warn that many of the positive results are due to repeat testing. This makes sense, when considering that the purpose of testing is both to diagnose and to monitor whether a person is still shedding virus. What this means is that the repeat positives are accounted for, so that only new cases are reported.
I urge folks to look at the numbers, read up on situations like this and realize what you are looking at is the best anyone can produce right now in the way of numbers.
When you deal with any kind of data collection, you have to be aware that not all data is reported at the same rate. Some labs might report daily, others might report weekly. Some data takes more effort to collect than other data--for example, Covid-19 deaths have to be confirmed with laboratory testing, which can take a while. Because of the inherent uncertainties, the CDC warns that reportable disease table data are provisional until finalized about 10 months after the end of the year.
Folks, I've never heralded the testing negatives here. I had alwys thought folks were smart enough to realize all the tests given minus the posities would be the the level of negatives. Maybe I was too optimistic.
I will say here that there are countless times I have carefully explained things with data and calculations that clearly demonstrate what I have explained and seen my explanations fly over people's heads. Many people simply do not understand mathematics.
As for positive and negative testing, the only reason to keep track of negative testing in the case of Covid-19 is to monitor the reach of testing. If a majority of cases are being identified, then performing more tests should result in a lower percentage of positive results. If performing more tests results in more positives, it means that an inadequate number of tests were previously being done.
So if the demographic that has little to fear from the disease is out there getting infected, it may not be a bad thing at all. If the Fatalities remain low, vastly higher cases may simply increase the rapidity of the saturation of the people in public who have already fought it off. And that may facilitate the end of the disease.
Fatalities are dropping, and that is a good thing. I think that the many interventional clinical trials that have been underway are panning out with good results that translate to clinical practices that are saving more lives. I know that when I listen to my local rock station, I frequently hear ads seeking people who have recovered from Covid-19 to donate serum to treat current Covid-19 patients--who knows how many lives have been saved by convalescent serum donations.
But as far as being immune from infection with Covid-19 once recovered, I wouldn't bet on it. Immunity to ordinary coronaviruses wanes within a few months, and antibodies against SARS-Cov2 seem to follow a similar pattern. A recent study showed that antibodies to Covid-19 wane rapidly, with people having "mild" cases having less robust antibody responses that wane to baseline after 60 days. Only some people with the most severe cases had antibodies that persisted to 94 days; the majority of survivors' antibody responses were undetectable by then. What this means for cellular immunity (memory B cells) is still under investigation. However, this study suggests that people remain susceptible to multiple Covid-19 infections. Also, antibodies against a virus aren't always protective...this is a complicated area and the details specific to Covid-19 are still being worked out.
This study highlights the fact that serology studies to look at past infection with SARS-CoV2 are useless. I have already pointed this out many times, on the basis that antibodies typically cannot distinguish between similar viruses (such as different strains of coronavirus); this study underscores my point from a different direction, in that antibodies against SARS-CoV2 do not persist.
Longitudinal evaluation and decline of antibody responses in SARS-CoV-2 infection
Seow J, Graham C, Merrick B, et al.
medRxiv 2020.07.09.20148429; doi:
https://doi.org/10.1101/2020.07.09.20148429
July 20:
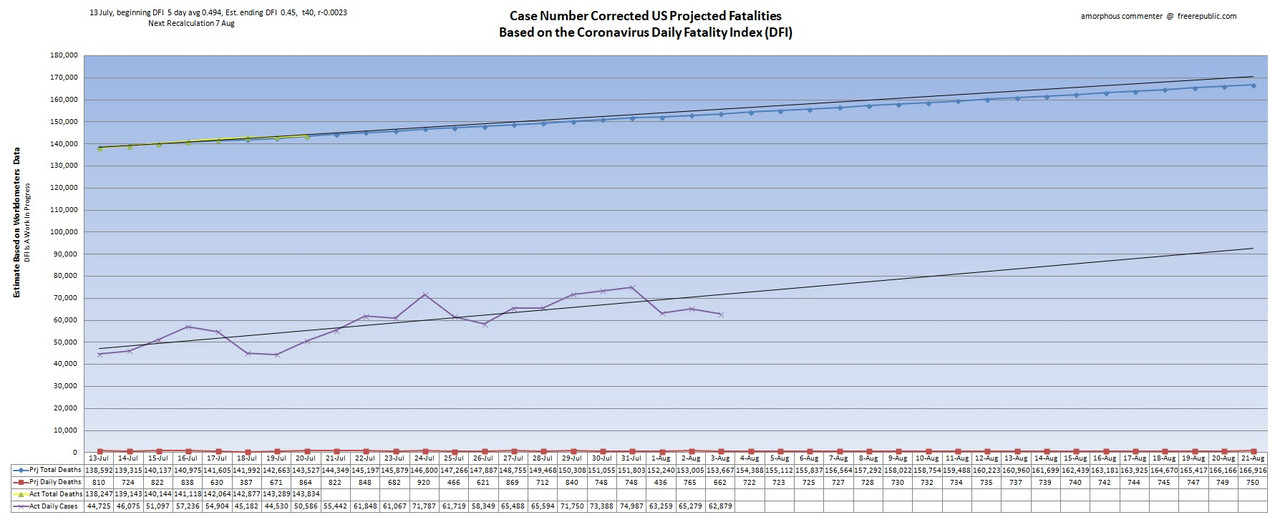
•Blue line represents projected death totals.
•Yellow line is actual death totals based on WorldofMeters.info data.
•Purple line is actual daily cases offset by 14 days.
•Red line represents projected daily deaths.
•Black extension lines are trend lines.
I started tracking the number of new hospitalizations of COVID patients in Florida.
During the week Jul 1 thru 7 there were an average 276 new covid hospitalizations each day.
During the week Jul 8 thru 14 there were an average 368 new covid hospitalizations each day.
Jul 15 = 491
Jul 16 = 366
Jul 17 = 441
Jul 18 = 339
Jul 19 = 292
Jul 20 = 517
We have had record numbers of new COVID cases in Florida for over four weeks.
We can conclude there is an increase in new hospitalizations for COVID infected patients. How this increase in new hospitalizations plays out is yet to be seen.
Given the fact that Florida has 62,000 hospital beds, the number of new hospitalizations of covid patients seems manageable.
Death rates in Florida are starting to creep higher.
Vaccine Information Page:
Perhaps this has been posted here before, but I just saw today...It is from NYT; however, but it is very informative regarding vaccine development...How many and which companies have candidates in various categories, and at which phase of clinical trials:
May need to have “account” w/NYT which requires an email, but I am interested in following this—good aggregator of vaccine information.
https://www.nytimes.com/interactive/2020/science/coronavirus-vaccine-tracker.html?utm_source=morning_brew
Disclaimer: Opinions posted on Free Republic are those of the individual posters and do not necessarily represent the opinion of Free Republic or its management. All materials posted herein are protected by copyright law and the exemption for fair use of copyrighted works.