Posted on 03/09/2013 11:23:01 AM PST by blam
Dow And Silver In Gold Terms
Commodities / Gold and Silver 2013
March 09, 2013 - 05:44 PM GMT
By: Richard Mills
The Dow on Gold's terms:
* During January 2000 gold traded at an average price of $284.32
* January 2000 the Dow was 10,900
* 10,900/$284.32 per ounce = 38.33 gold ounces to buy the Dow
Today gold is trading at $1570.90 while the Dow Jones (DJIA) continues to break records, up another 30 points as I write to 14,284.
14,284/1570.90 = 9.09 ozs of gold to buy the Dow today.
38.33/9.09 = 4.2

The Dow on Silver's terms:
During January 2000 silver averaged $4.95 oz January 2000 the Dow was 10,900 10,900/$4.95 per ounce = 2202 silver ounces to buy the Dow
Today silver is trading at $28.62, the Dow is 14,284.
14,284/28.62 = 499 ozs silver to buy the Dow.
2202/499 = 4.4

The Dow has gone up roughly, and only, 3400 points since January 2000.
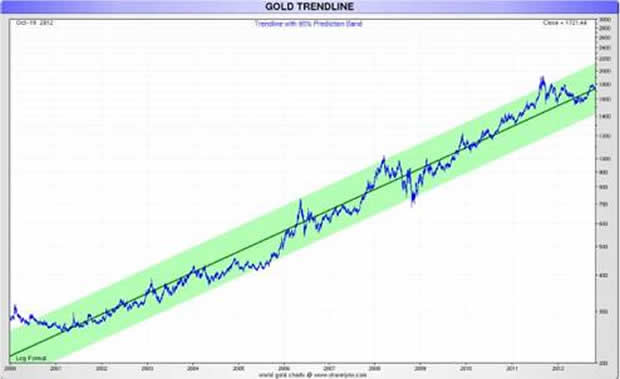
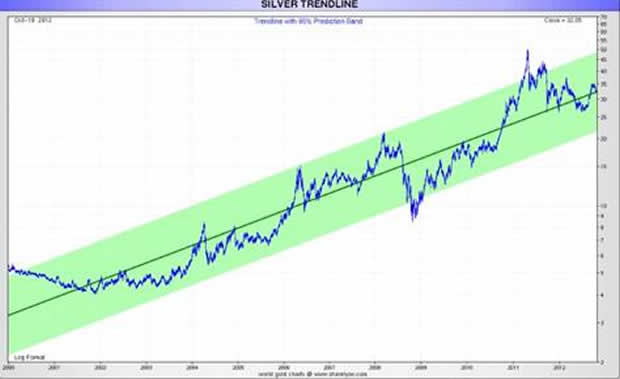
Gold, during the same period, has gone from an average of $284 to $1570.90 ($1570.90/$284 = 5.5x) while silver has gone from an average of $4.95 to $28.62 ($28.62/$4.95 = 5.7x) per oz.
In January 2000 the gold/silver ratio was $284.32/$4.95 = 57.43
Today, as I calculate these numbers, gold is $1570.90 oz while silver is $28.62 oz for a gold/silver ratio of 54.88.
Silver, a.k.a. 'poor man's gold' trades in lockstep with gold - from a ratio of 57.4 in 2000 to a ratio of 54.8 today some 13 years later who can argue?
Joe and Suzie on Gold's Terms
We've seen how gold and silver are doing relative to each other and the Dow. How is Joe & Suzie Average making out on gold's terms? Let's take a look at housing and wages...

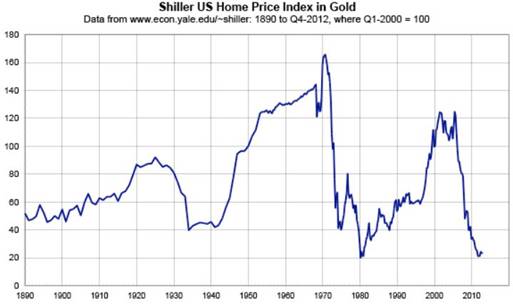
Today's home prices are lower than they were during the Great Depression and are approaching their all-time lows.
"At first, the drop in the dollar simply offset the apparent rise in home prices, and prices in gold worked sideways until 2006. But when home prices began to fall in dollar terms, and dollars were themselves falling in value, the double-whammy pushed true home prices down to levels not seen since the late 1980s. In fact, they set a new record, the lowest level since the index was first published. This means that most homes purchased in the last 20 years are now worth less than the original purchase price, even if they show gains of 100%, 200%, or more, in dollar terms." ~ pricedingold.com
The average U.S. worker earned $13.75 an hour in January of 2000. As we already know the price of an ounce of gold averaged $284.
The average worker would have had to work 20.65 hours ($284/$13.75) to buy an oz of gold in January, 2000.
Today the average U.S. workers wage is $19.77 and gold is $1570.90 oz - the average working Joe/Suzie would have to work 79.45 hours to buy an oz.
Consider: Global conflicts are intensifying and raising already considerable tension levels. Zero interest rates, global quantitative easing and escalating currency wars - an international race to worthless that ends with everyone a loser and leads to a rise in protectionism and future trade wars
After mulling over all that's happening in the world today ask yourself "what chance does Joe and Suzie have of buying gold and silver cheaper in the future than now?"
Conclusion
Buying some gold and silver should be on everyone's radar screens. Is it on your screen?
If not, maybe buying either, or a bit of both, should be.
ping
I guess if we are cherry-picking start points and end points:
Let’s pick around the day I graduated College: June 10, 1981:
Dow Jones: 993.88
Gold: $465.25
Today: DJIA: 14397
Gold: $1,578.50
So, stocks increased 13.48 times.
Gold increased 2.39 times.
Note: That isn’t Gold’s peak (which was 819), nor is it DJIA low (which was close to 25% lower)
So, when I graduated College, if I put all my money in stocks, I did much better than if I put all my money in gold. If I had any money.
If when the economy crashed by 2009, and Obama got elected, I would have panicked, and sold all my stocks and bought gold, I’d have about doubled my money either way.
Now, do the same for two more cases: The DOW compared to “oil” between 1920 and 2013 ...
That same price of oil compared to the price of gold between 1920 and 2013.
Thanks RACPE.
ping
Gold/Silver vs Dow
I guess the lesson I take from this instructive post is that junk silver (coins) is a useful investment now to hedge against a slow economic decline as well as a SHTF scenaqrio. Yes?
TC
bfl
Bump for later.
I am not in position to do this...not enough money but the ultimate is gold outside the US such as buy it in Canada and put in a safe deposit box there far beyond the reach of Obama and future Obamas. Beyond ultra-taxation (Obama style) on precious metals buy/sell transactions or confiscation
Diversify with junk silver held here plus pure silver one ounce coins. Plus gold coins held in America by you buried in backyard what have you
When I’m being funny, I pick something from 1920 like a new belt buckle. Then I show how that particular belt buckle is now worth tens of thousands because it is a collectable.
Goldbug ping.
| year | gold $/oz | gas $/gal | gas gal/gold-oz | DJI (highs) | DJI shrs/gold-oz |
| 1970 | 35.44 | 0.35 | 101.26 | 728.23 | 20.55 |
| 1975 | 164.24 | 0.53 | 309.89 | 884.62 | 5.39 |
| 1981 | 464.76 | 1.19 | 390.55 | 1,023.02 | 2.20 |
| 1990 | 352.33 | 1.00 | 353.33 | 2,948.54 | 8.37 |
| 1998 | 292.32 | 1.06 | 275.77 | 9,104.72 | 31.15 |
| 2000 | 282.00 | 1.51 | 186.75 | 10,863.00 | 38.52 |
| 2003 | 355.00 | 1.59 | 223.27 | 9,352.77 | 26.35 |
| 2006 | 600.00 | 2.59 | 231.66 | 11,285.82 | 18.81 |
| 2009 | 945.00 | 2.35 | 402.13 | 8,877.93 | 9.39 |
| 2011 | 1520.00 | 3.53 | 430.59 | 12,569.49 | 8.27 |
| 2013 | 1578.00 | 3.82 | 413.09 | 14,413.17 | 9.13 |
historic gasoline prices in the US: source
historic gold prices: source
historic DJI prices: source
note:
looking at this data, your cost of fuel is roughly the same today as in 1981.. 390 vs 413...
but you can get almost 4 times as many shares of DJIA today as you could in 1981. this could
imply the companies are cheaper/valued in lower value dollars.
And has been the lesson for the past 35 years. You’ve
learned well!
You have the calculations backwards.
The DJI chart shows the number of dollars it would cost to buy one “share” of the DJIA. Higher is a higher value. So, the last column is wrong.
In 1970, it would take 20 ounces of gold to purchase 1 share of stock.
In 1981, it would take 2.2 ounces of gold to purchase 1 share of stock. Clearly, between 1970 and 1981, gold did much much better than stocks.
But by today, it would take 9.13 oz of gold to purchase 1 share of stock. That’s over 4 times as expensive. So between 1981 and today, stocks did over 4 times as good as gold.
For the last column to be the number of shares you could buy with an ounce of gold (instead of how many ounces of gold would buy you one share, you have to invert.
In 1970, an ounce of gold purchased 1/20th of a share.
In 1981, an ounce of gold purchased 1/2 of a share.
In 2013, an ounce of gold purchase 1/10 of a share.
What all the charts show is that gold is extremely volatile, and is not in the short term a good proxy for constant wealth.
And Gold still has one major problem — it is illusion. The amount of gold we have today is way more than what is needed for all the required uses of gold. As a commodity, supply far outstrips demand.
Gold prices therefore are acting much more like “collector” pricing than commodity pricing. People “want” gold, like people might want a Van Gogh painting. So long as that is true, the value might hold, and the value swings wildly as people become more or less enamored with collecting gold.
But any day, the world could decide they aren’t interested in Gold. After all, it can’t be eaten, it is useless to most people as a metal, vanity only gets you so far. People may never lose their interest, but they could. Nobody NEEDS gold, at least not in the quantities that exist.
And on the day that people realize that, gold will cease to be a useful investment. That will happen in my opinion when the world enters 1st-world status.
The fact that gold tends to not obey supply/demand equations is a signal. What would happen if we found a new gold deposit that doubled the supply? In the current market, very little. It’s also why buying mining stocks doesn’t seem to track gold very well.
BTW, if you priced gold in oil, you’d find that gold hasn’t changed value much.
Not just junk silver, but American Gold Eagles and American Silver Eagles.
The way I see the predicament Bernanke is in is, They are buying bonds with counterfeit money. The money is tied up in bonds and OFF the market. At some point, the bonds will liquidate and release the fictitious money into the system. Gold will go up Then and only then. We have printed trillions of dollars to keep this mess afloat, but it will end at some point.
We went through similar times during Carter. Inflation will be rampant and gold will remain constant in dollar terms. as the dollar falls, gold will rise( along with all other commodities.)
Imo, this is why Dems don't seem to care about borrowing and paying back with printed money. As gold goes closer to $5000 an oz., they just look at is as I'm making $50 an hour instead of $20, and gas is $9 a gallon,...so what? Well if you are a saver trying to retire, you are wiped out in 5 years instead of 25. A sound dollar always makes for more steady times for everyone, except politicians.
Another problem might rear it's head when we try to pay back China, or others, with counterfeit money. If they loan us a trillion dollars and we try to pay them back with $600 million, they might just take exception to that with a few missiles. Remember they are just getting a pittance for interest. If the dollar falls too fast, they actually loan us money at negative interest rates. I wouldn't be happy, I doubt they will be. If we weren't America, we would look closer to Argentina. We will have gone under long before the Argentina type rates of 20+%.
Disclaimer: Opinions posted on Free Republic are those of the individual posters and do not necessarily represent the opinion of Free Republic or its management. All materials posted herein are protected by copyright law and the exemption for fair use of copyrighted works.