Skip to comments.
Global Temperature Trends From 2500 B.C. To 2040 A.D.
[Awesome chart]
Long Range Weather.com ^
| Cliff Harris & Randy Mann
Posted on 03/04/2010 8:58:57 AM PST by SloopJohnB
click here to read article
Navigation: use the links below to view more comments.
first 1-20, 21-38 next last
Paging Al Gore!!
To: SloopJohnB
To: Uncle Miltie
Oh yes, I see now how you could lay a “hockeystick” on that graph and it would fit perfectly...
3
posted on
03/04/2010 9:02:11 AM PST
by
Hegemony Cricket
(The emperor has no pedigree.)
To: SloopJohnB
Here's a sunspot chart showing the various peaks and dips throughout the past centuries. Note the "Medieval Max". It corresponds to the "Medieval Warm Period". The "Maunder Minimum" corresponds to the "Little Ice Age", and the "Modern Max" to the recent warming trend we had been experiencing, at least until the past several years or so.
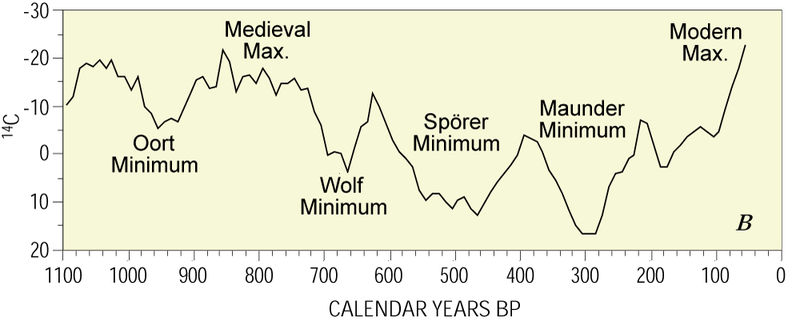
"Changes in carbon-14 concentration in the Earth's atmosphere, which serves as a long term proxy of solar activity. Note the present day is on the left-hand side of this figure."
http://en.wikipedia.org/wiki/Solar_activity
4
posted on
03/04/2010 9:04:15 AM PST
by
ETL
(ALL (most?) of the Obama-commie connections at my FR Home page: http://www.freerepublic.com/~etl/)
To: SloopJohnB
Kewl Chart.
Did anyone besides me notice that every cooling period seems to be more intense than the pervious one?
5
posted on
03/04/2010 9:04:49 AM PST
by
BuffaloJack
(If you're not patriotic, you're nothing !)
To: SloopJohnB; tubebender; marvlus; IrishCatholic; Carlucci; Desdemona; meyer; Para-Ord.45; ...
6
posted on
03/04/2010 9:05:08 AM PST
by
steelyourfaith
(Warmists as "traffic light" apocalyptics: "Greens too yellow to admit they're really Reds."-Monckton)
To: SloopJohnB
For those here not scientifically learned...
There is something called ‘significant figures’ used when you take measeurements. The reason being that you cannot be more precise than your measurement instruments.
If all you have is a yard stick, you can never measure something to millimeter precision.
If you have a thermometer calibrated to degrees, you can never be more precise than a half or quarter of a degree or so.
If all you have is tree rings you CANNOT say the temperature in degrees, EVER.
You can make general assumptions that one year was warmer than the previous by the width of the rings, but you can never know the precise temperature was 57 degrees on any year, if you never had a thermometer to measure the degrees. Especally temperatures 2000 years ago.
This is why global warming and the scientists who promote it are frauds
7
posted on
03/04/2010 9:07:34 AM PST
by
Mr. K
(This administration IS WEARING OUT MY CAPSLOCK KEY!)
To: Uncle Miltie
The chart shows a trend in the oscillations to the cold side — the peaks are increasingly deep and coming more frequently. I hope our current downturn doesn’t outstrip the LIA.
8
posted on
03/04/2010 9:08:11 AM PST
by
Paine in the Neck
(Ense petit placidam sub libertate quietem)
To: SloopJohnB
As you can see at 1100 BC everyone was hot for Helen of Troy and the temperature increased dramatically. It was all those unleaded chariots. Throughout history we fina a major source of the Climate is the Sun and Egyptian worship of the sun god added to the turmoil!
We must sacrifice maiden or at least a Gore to set things right or straitjacket him!
To: SloopJohnB
It was those darn internal combustion engines that caused all that warming in 1100 BC.
To: BuffaloJack
No but, now that you point it out, interesting. It’s freezing most of the year where I live. I could use a little global warming, so keep buying those SUV’s.
11
posted on
03/04/2010 9:14:15 AM PST
by
MsLady
(If you died tonight, where would you go? Salvation, don't leave earth without it!)
To: Mr. K
50% of all “science” is bunk.
12
posted on
03/04/2010 9:14:48 AM PST
by
glide625
To: Mr. K
I’m a little suspicious of this chart for the reasons you describe. And as a certified dumb guy, even I find it hard to believe that there is some kind of nexus between global cooling and volcanic activity. Any thoughts?
13
posted on
03/04/2010 9:17:44 AM PST
by
Bramuce
To: SloopJohnB
Amazing how things work out ... I was just trying to explain this to my cousin. He said he couldn’t abandon his belief in man-made global warming without proof it isn’t real. The chart with this article makes it very plain that the entire global warming cuased by humankind issue is a SCAM! Thanks so much for posting this. I made a large copy of the chart, to help my liberal cousin see the graphic evidence.
14
posted on
03/04/2010 9:18:50 AM PST
by
MHGinTN
(Obots, believing they cannot be deceived, it is impossible to convince them when they are deceived.)
To: SloopJohnB
Excellent!
Thanks for the post.
15
posted on
03/04/2010 9:19:00 AM PST
by
Mrs.Z
To: Bramuce
Four major eruptions would cause lots of ash and debris to cloud the atmosphere, causing less heat from the sun to reach earth? I’m assuming, much like the concept of nuclear winter?
16
posted on
03/04/2010 9:20:40 AM PST
by
IamCenny
To: IamCenny
Excuse me, 90 major eruptions.
17
posted on
03/04/2010 9:21:36 AM PST
by
IamCenny
To: glide625
L'Anse aux Meadows, Newfoundland = Vikings in and around AD 1000. Little ice age caused the Viking settlement to be frozen in Greenland in AD 1350 +/-.
Temperature swings are part of Earth's history. And Algore's `Inconvenient Lie` just adds to the statist propaganda re: Cap & Tax & tax, and other Greenie Weenie nonsense.
18
posted on
03/04/2010 9:23:46 AM PST
by
BigEdLB
(Now there ARE 1,000,000 regrets - but it may be too late.)
To: SloopJohnB
At just a glance at the colored chart, you would never conclude “GLOBAL WARMING ALARM”. I’m impressed by the depth of recent COOLING trends as someone else mentioned.
19
posted on
03/04/2010 9:25:28 AM PST
by
faucetman
(Just the facts ma'am, just the facts)
To: Young Werther
Good point. And just look what Helen of Thomas has caused...
20
posted on
03/04/2010 9:26:53 AM PST
by
DoughtyOne
(If we as Republicans can't clean up our house, how can)
Navigation: use the links below to view more comments.
first 1-20, 21-38 next last
Disclaimer:
Opinions posted on Free Republic are those of the individual
posters and do not necessarily represent the opinion of Free Republic or its
management. All materials posted herein are protected by copyright law and the
exemption for fair use of copyrighted works.
FreeRepublic.com is powered by software copyright 2000-2008 John Robinson

