Posted on 08/02/2004 10:16:47 AM PDT by Momaw Nadon
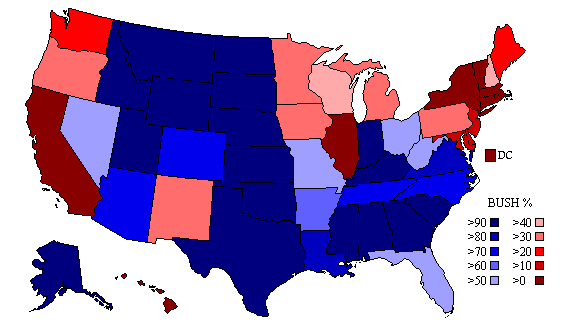
| State | % Chance of Bush Winning | Bush Electoral Votes | Kerry Electoral Votes |
| Alabama | 97.0 | 9 | 0 |
| Alaska | 94.0 | 3 | 0 |
| Arizona | 72.0 | 10 | 0 |
| Arkansas | 62.0 | 6 | 0 |
| California | 9.0 | 0 | 55 |
| Colorado | 78.0 | 9 | 0 |
| Connecticut | 5.0 | 0 | 7 |
| Delaware | 14.0 | 0 | 3 |
| District of Columbia | 0.9 | 0 | 3 |
| Florida | 52.0 | 27 | 0 |
| Georgia | 93.0 | 15 | 0 |
| Hawaii | 5.0 | 0 | 4 |
| Idaho | 95.0 | 4 | 0 |
| Illinois | 9.0 | 0 | 21 |
| Indiana | 93.0 | 11 | 0 |
| Iowa | 36.0 | 0 | 7 |
| Kansas | 94.0 | 6 | 0 |
| Kentucky | 91.0 | 8 | 0 |
| Louisiana | 80.3 | 9 | 0 |
| Maine | 25.0 | 0 | 4 |
| Maryland | 15.0 | 0 | 10 |
| Massachusetts | 4.0 | 0 | 12 |
| Michigan | 34.0 | 0 | 17 |
| Minnesota | 32.7 | 0 | 10 |
| Mississippi | 96.0 | 6 | 0 |
| Missouri | 55.6 | 11 | 0 |
| Montana | 94.0 | 3 | 0 |
| Nebraska | 96.0 | 5 | 0 |
| Nevada | 51.5 | 5 | 0 |
| New Hampshire | 44.0 | 0 | 4 |
| New Jersey | 14.0 | 0 | 15 |
| New Mexico | 32.0 | 0 | 5 |
| New York | 6.0 | 0 | 31 |
| North Carolina | 74.0 | 15 | 0 |
| North Dakota | 96.0 | 3 | 0 |
| Ohio | 53.0 | 20 | 0 |
| Oklahoma | 96.0 | 7 | 0 |
| Oregon | 35.0 | 0 | 7 |
| Pennsylvania | 35.0 | 0 | 21 |
| Rhode Island | 4.0 | 0 | 4 |
| South Carolina | 96.0 | 8 | 0 |
| South Dakota | 95.0 | 3 | 0 |
| Tennessee | 76.0 | 11 | 0 |
| Texas | 97.0 | 34 | 0 |
| Utah | 96.0 | 5 | 0 |
| Vermont | 5.0 | 0 | 3 |
| Virginia | 81.0 | 13 | 0 |
| Washington | 22.5 | 0 | 11 |
| West Virginia | 52.5 | 5 | 0 |
| Wisconsin | 42.5 | 0 | 10 |
| Wyoming | 96.0 | 3 | 0 |
| Totals | 274 | 264 |
According to the current trading prices of the futures contracts, an estimate can be found of what traders are betting will be the outcome of 2004 Presidential Election.
If the traders are correct, President Bush would receive 274 Electoral Votes and John Kerry would receive 264 Electoral Votes.
If the weighted probabilities of President Bush winning in the states are added up, and then divided by 538, and multiplied by 100, then President Bush should get 264.28 Electoral Votes.
270 Electoral Votes are needed to win the Presidency.
Opinions and commentary are welcome.
2004 Projected Presidential Electoral Votes as of 7/26/2004
2004 Projected Presidential Electoral Votes as of 7/19/2004
2004 Projected Presidential Electoral Votes as of 7/12/2004
2004 Projected Presidential Electoral Votes as of 7/5/2004
2004 Projected Presidential Electoral Votes as of 6/28/2004
2004 Projected Presidential Electoral Votes as of 6/21/2004
2004 Projected Presidential Electoral Votes as of 6/14/2004
2004 Projected Presidential Electoral Votes as of 6/7/2004
2004 Projected Presidential Electoral Votes as of 5/31/2004
2004 Projected Presidential Electoral Votes as of 5/24/2004
2004 Projected Presidential Electoral Votes as of 5/17/2004
2004 Projected Presidential Electoral Votes as of 5/10/2004
2004 Projected Presidential Electoral Votes as of 5/3/2004
2004 Projected Presidential Electoral Votes as of 4/26/2004
2004 Projected Presidential Electoral Votes as of 4/19/2004
2004 Projected Presidential Electoral Votes as of 4/12/2004
2004 Projected Presidential Electoral Votes as of 4/5/2004
2004 Projected Presidential Electoral Votes as of 3/29/2004
2004 Projected Presidential Electoral Votes as of 3/22/2004
2004 Projected Presidential Electoral Votes as of 3/15/2004
2004 Projected Presidential Electoral Votes as of 3/8/2004
2004 Projected Presidential Electoral Votes as of 3/1/2004
2004 Projected Presidential Electoral Votes as of 2/23/2004
2004 Projected Presidential Electoral Votes as of 2/16/2004
2004 Projected Presidential Electoral Votes as of 2/9/2004
2004 Projected Presidential Electoral Votes as of 2/2/2004
2004 Projected Presidential Electoral Votes as of 1/26/2004
2004 Projected Presidential Electoral Votes as of 1/21/2004
Bush spent the weekend here in Ohio. At one point on talk radio they were joking about how the campaigns might actually pass each other on route 71.
His frenchiness was here this weekend as well.
Does this graph show declining popularity and vote count or does it show more of a convergence on the solution?
Not much of a change from the 2000 vote. Do folks really believe Bush will lose New Hampshire?
The Frenchurian Candidate
It shows more of a convergence on the solution.
The political futures seem to be a trailing indicator of what the polls are saying.
To bad the polling is not done by counties. Thinking about the red/blue map from 2000, I think that the only places that Kerry really has a lock are the urban hotspots (NYC, Philly, Chicago, Detroit, etc.).
Funny how Kerry can parade around saying that the country is with him not the President, when the country doesn't support Kerry at all...just the urban hot spots, which have never been and hopefully never will be the declared intentions of our country.
City-fied morons.
At this moment, the political futures traders on TradeSports.com believe that President Bush has a 44.0% chance of winning New Hampshire.
I'm locked out of that location here at work. Does the site also have the % for Kerry to win? If so how does that compare?
"The Frenchurian Candidate"
Hey, I like that. I'm going to start using it. Thanks.
Feel free to use it. I just heard it from a caller on the Rush Limbaugh show.
In a separate futures contract, the traders on TradeSports.com believe President Bush has a 53.3% chance of being re-elected as United States President.
| Date | Prob. Bush Win | Mean EVs | Std. Dev. |
| 01/21 | 96.8% | 341.5 | 41.1 |
| 01/26 | 95.5% | 334.8 | 40.6 |
| 02/02 | 92.2% | 323.8 | 39.7 |
| 02/09 | 83.0% | 307.8 | 40.3 |
| 02/16 | 78.4% | 300.4 | 39.4 |
| 02/23 | 76.2% | 298.2 | 39.6 |
| 03/01 | 74.5% | 295.9 | 39.3 |
| 03/08 | 68.0% | 289.2 | 39.8 |
| 03/15 | 68.0% | 288.8 | 39.0 |
| 03/22 | 68.5% | 289.3 | 38.8 |
| 03/29 | 69.4% | 290.1 | 38.8 |
| 04/05 | 71.2% | 292.3 | 39.1 |
| 04/12 | 70.4% | 290.6 | 38.1 |
| 04/19 | 68.6% | 288.1 | 36.7 |
| 04/26 | 64.9% | 284.5 | 36.3 |
| 05/03 | 66.3% | 285.7 | 36.3 |
| 05/10 | 65.6% | 285.3 | 36.8 |
| 05/17 | 65.2% | 284.8 | 36.6 |
| 05/24 | 60.0% | 280.3 | 36.9 |
| 05/31 | 61.1% | 281.2 | 36.8 |
| 06/07 | 60.5% | 280.6 | 36.5 |
| 06/14 | 65.0% | 285.0 | 36.6 |
| 06/21 | 63.9% | 284.0 | 36.8 |
| 06/28 | 58.4% | 278.8 | 36.7 |
| 07/05 | 58.7% | 279.1 | 36.7 |
| 07/12 | 53.1% | 274.2 | 36.5 |
| 07/19 | 48.2% | 269.8 | 35.7 |
| 07/26 | 43.4% | 265.6 | 35.0 |
| 08/02 | 42.1% | 264.3 | 34.7 |
The rate of decline seems to have slowed down.
The turnaround will possibly start next week.
Hehhehhehee...."The Frenchurian Candidate"
Good one!
Bush still on top here, and back up in Iowa electronic futures market. This was Kerry's best shot. He's pathetic.
Disclaimer: Opinions posted on Free Republic are those of the individual posters and do not necessarily represent the opinion of Free Republic or its management. All materials posted herein are protected by copyright law and the exemption for fair use of copyrighted works.