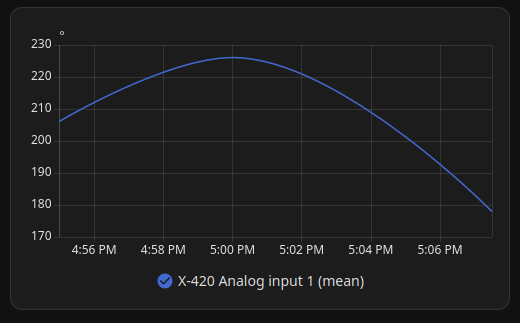
It was up close to 270 or West but this is a; last 5 minutes graph; so that's missing. Hasn't been hooked up long enough for a 1 hour graph. A graph for the airport looks different since it gets updated every 5 minutes instead of being in real-time. Looks like a sine wave - square wave with the line going either vertical or horizontal.
Caught about 60 gal of rain off 1/4 of the tunnel roof today from our mist to occasional rain.