Posted on 12/21/2025 9:19:11 PM PST by SeekAndFind
A ranking of 193 countries shows that human development is stalling almost everywhere
IN THE THROES of the covid-19 pandemic—when hospitals overflowed, schools and offices shut, and economies seized up—many asked when the world would recover. Five years later, the data show that the setback to living standards could endure.
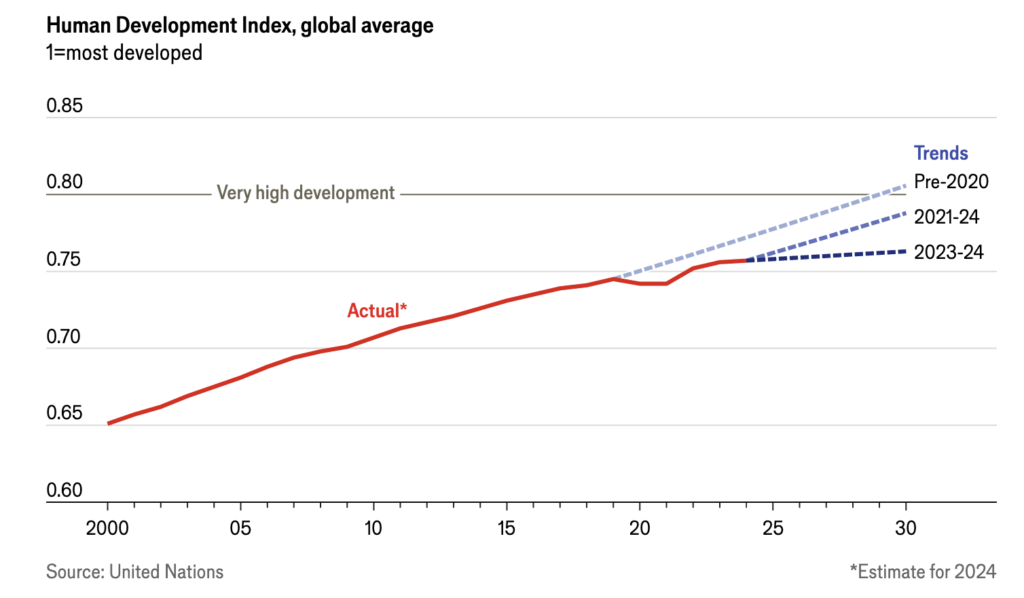
The Human Development Index (HDI), produced by the UN, tracks progress in life expectancy, education and income. After GDP it is one of the most widely used measures of development. The global score fell in 2020 and 2021—the first declines since the index began in 1990. It recovered somewhat in 2022. The latest report, released on May 6th, shows that the pace of improvement in 2023 was the slowest on record (see chart).
Rich countries, unsurprisingly, do best. Ninety-seven per cent of them have fully recovered or exceeded their pre-pandemic scores, says Achim Steiner of the United Nations Development Programme. That is true of less than 60% of poor countries.
After two years at the top Switzerland was edged out (barely) by Iceland. Nordic countries have the highest spots in most rankings that measure quality of life. A baby born in Iceland today is expected to live longer than 82 years and receive more than 18 years of schooling. Average income per person is close to $70,000 (explore the full ranking below).
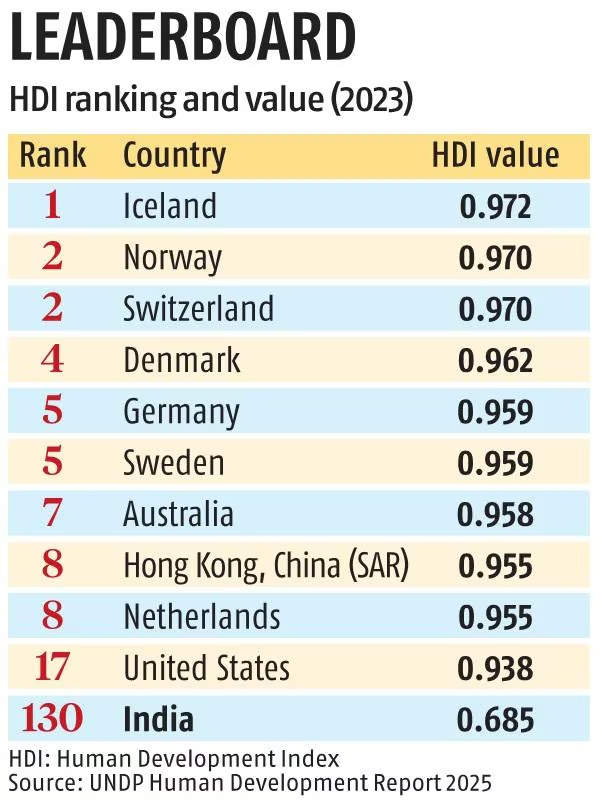
The index does not consider inequality within countries (the UN publishes separate indices on that). Living standards for rich and poor citizens can vary widely. Rich Americans tend to have much longer lives than poor ones. But money isn’t everything. A study led by researchers at Brown University, published in April, found that the richest people in America (which ranks 17th on the HDI) have a mortality rate similar to that of the poorest northern and western Europeans and to that of most eastern Europeans.
The bottom of the index is dominated by sub-Saharan Africa. Life expectancy at birth in South Sudan, the lowest-ranked country, is less than 58 years, average schooling is less than six years and gross national income per person is just $688. After decades of narrowing, the gap between countries at the top and bottom of the index has widened for four years running. The world’s poorest countries have stalled on other indicators, too. Extreme poverty has barely fallen since 2015. Measures of public health have declined since covid. And since the mid-2010s economic growth rates in poor economies have been slower on average than in richer ones. Cuts to aid budgets by governments in America and Europe will make things worse for poor countries. According to the HDI, countries in the Arab world and Latin America and the Caribbean have had the slowest post-pandemic recovery in living standards.
For decades it looked as though on average the world would reach very high levels of development before 2030. If today’s sluggish progress continues, it could take decades longer to reach that milestone.■
I would have guessed Somalia, Nigeria and Republic of the Congo. Offhand.
I have a suspicion the economic situation is worse than the numbers / graphs indicate, for many in the middle class.
Education is highly problematic too. What good is 18 years of education if much of it was nonsense?
And what good is any of this if so many have lost their souls? I’m not even talking about the afterlife, either... :-(
For lack of personal freedom, Hong Kong SAR has been falling in more comprehensive measures of human flourishing.
https://index.prosperity.com/globe#HKG
Hmm. Is this the same United Nations that shut down Trump’s escalator and microphone?
How credible is ANY document produced by that vile organization?
,,, the most credible document is the dinner menu for delegates to the UN's food sustainability conferences.
1. This needs to be GDP at purchasing power parity, not nominal currency rates. How far does your money actually go?
2. Compare Danes to Danish Americans. Swedes to Swedish Americans. Germans to German Americans. You will quickly see that the US is far wealthier per capita. There are very few European countries wealthier per capita than the US. Luxembourg (tiny little tax haven), no doubt Monaco (same deal), Norway (world’s 4th? largest energy exporter with tiny little 4.5 million population), etc.
Germany? France? Belgium? The UK? Not even close. The US is much wealthier than they are per capita. If you doubt it just go there and look around. I could see the US was significantly wealthier when I last lived over there in 2004. The gap has only grown much wider since then.
Totally uncredible.
Luxembourg is significantly smaller than metro Atlanta (just under 1000 sq. miles vs. 8376 for the Atlanta MSA). And has a relatively tiny population, only 680,000 vs 6.3 million. Just to give a sense of scale for your tax haven.
The Economist?
BARF!
Only Leftist Lies are found there.
So India's HDI varies extremely among the 1.4 BILLION people living in the sub-continent

GDP per capita is not a good measure of individual “wealth” as it takes the net GDP and divides it by population - so if in a population of 100 people, 1 guy earns $99,901,000 and the others earn $1,000 each, then the GDP per capita is $1 million, but that is not the true wealth of each.
For instance, the USA’s GDP per capita is $76,600 and the GDP per capita of the Republic of Ireland is $129,000. But the individual Irishman is NOT wealthier than an American - rather it is because the GDP is driven largely by multinational corporate profit accounting rather than local household income
There are better metrics for “wealth” - like Median Wealth per Adult.
If you look at Median wealth, you get
Luxembourg: ~$395,340
Denmark: ~$216,098
The UK: ~$176,370
France: ~$146,017
Norway: ~$142,501
USA: ~$124,041
Sweden: ~$111,270
Germany: ~$66,735
India: ~$3,457
Or, I prefer Median Disposable Income - adjusted by PPP from statranker.com
then
luxembourg - $49,748
USA $46,625
Norway $41,621
Germany $32,246
Denmark $31,324
France $29,759
Sweden $28,859
UK $26,687
I think this is a better one than “household wealth” - as for household wealth they include property owned and property prices in the UK are sky high while Germans mostly rent.
This last statistic agrees with your point that Americans ARE richer on average - but it doesn’t have the glaring errors that GDP/capita have
But Americans have bigger houses, detached single family houses and (by European standards) huge yards, bigger cars, just more stuff around and they buy more. Everything from junk to boats, clothes, electronics, etc etc. They have more. Even relatively poorer states like Arkansas (where I lived for 5 years) or Mississippi are on par with Germany in terms of wealth per capita and if you excluded some of the very poor Black areas of those states, the rest is clearly richer than what you'll typically see even in For example Belgium or France, etc. The richer areas in the US just blow away all but the really small rich areas in Europe (ie Luxembourg, Norway, Switzerland). You don't need a statistician to tell you this. Your eyes will tell you.
Disclaimer: Opinions posted on Free Republic are those of the individual posters and do not necessarily represent the opinion of Free Republic or its management. All materials posted herein are protected by copyright law and the exemption for fair use of copyrighted works.