Posted on 11/16/2023 8:31:48 PM PST by SeekAndFind
Food is the palate’s poetry, the body’s fuel, and a shared language transcending cultures... when people can afford it.
As Visual Capitalist's Pallavi Rao details below, the World Health Organization found that the COVID-19 pandemic and war in Ukraine pushed 122 million more people into food insecurity between 2019 and 2022. Higher food prices, combined with increasing poverty, have resulted in rising food unaffordability, especially in certain regions of the world.
ℹ️ A person is food insecure when they lack regular access to enough safe and nutritious food for normal growth and development and an active and healthy life.
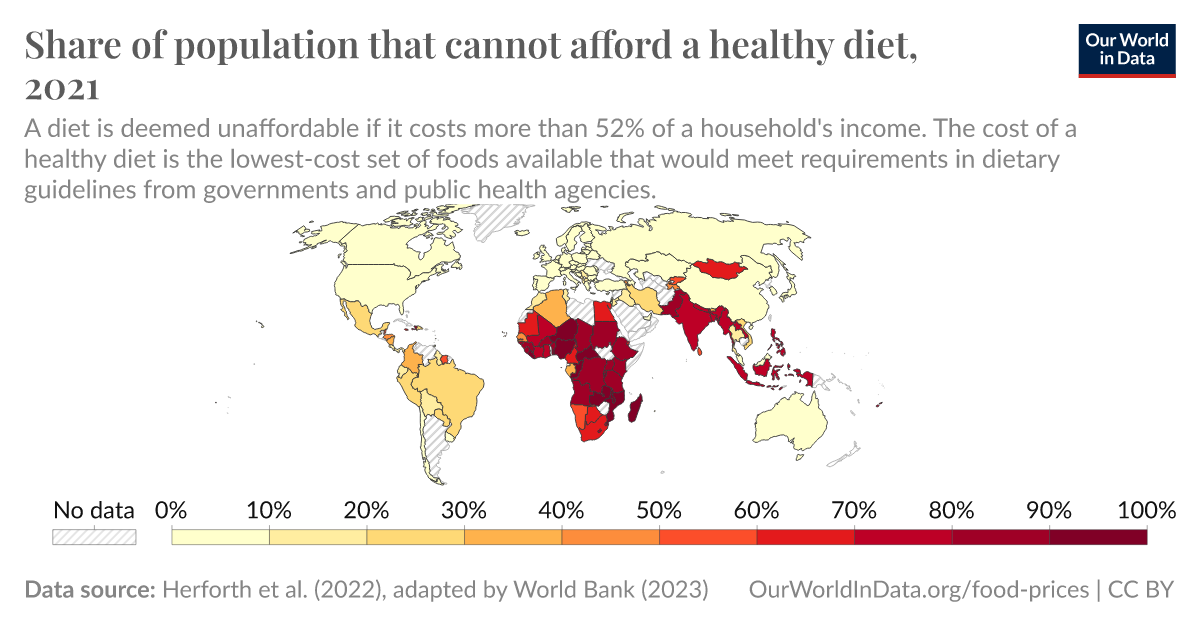
Our World in Data uses statistics gathered by the World Bank to map the share of the population that cannot afford a healthy diet in every country it has data for.
A healthy diet—in this case, one that meets government dietary guidelines—is considered unaffordable in a country when its cost exceeds 52% of per capita income per day.
Immediate trends in food unaffordability are discoverable from a glance at the map. The wash of red in Africa, South Asia, and Southeast Asia indicates the regions where the majority of the population cannot afford a healthy diet.
Ranking the countries by pure percentages in the table below allows us to get a closer look at country-level issues.
| Rank | Country | Can't Afford Healthy Diet |
|---|---|---|
| 1 | 🇲🇬 Madagascar | 97.8% |
| 2 | 🇧🇮 Burundi | 95.9% |
| 3 | 🇲🇼 Malawi | 95.9% |
| 4 | 🇨🇫 Central African Republic | 94.6% |
| 5 | 🇳🇬 Nigeria | 93.5% |
| 6 | 🇱🇷 Liberia | 92.8% |
| 7 | 🇭🇹 Haiti | 92.6% |
| 8 | 🇲🇿 Mozambique | 92.5% |
| 9 | 🇳🇪 Niger | 92.0% |
| 10 | 🇨🇬 Congo | 91.5% |
| 11 | 🇿🇲 Zambia | 90.0% |
| 12 | 🇬🇳 Guinea | 89.1% |
| 13 | 🇦🇴 Angola | 88.0% |
| 14 | 🇱🇸 Lesotho | 87.9% |
| 15 | 🇨🇩 DRC | 85.5% |
| 16 | 🇸🇩 Sudan | 85.4% |
| 17 | 🇹🇿 Tanzania | 85.0% |
| 18 | 🇬🇼 Guinea-Bissau | 84.6% |
| 19 | 🇪🇹 Ethiopia | 83.8% |
| 20 | 🇸🇱 Sierra Leone | 83.5% |
| 21 | 🇹🇩 Chad | 83.1% |
| 22 | 🇵🇰 Pakistan | 82.8% |
| 23 | 🇧🇯 Benin | 82.6% |
| 24 | 🇷🇼 Rwanda | 82.0% |
| 25 | 🇺🇬 Uganda | 81.7% |
| 26 | 🇸🇹 Sao Tome & Principe | 78.2% |
| 27 | 🇧🇫 Burkina Faso | 77.6% |
| 28 | 🇬🇭 Ghana | 77.4% |
| 29 | 🇳🇵 Nepal | 76.4% |
| 30 | 🇮🇳 India | 74.1% |
| 31 | 🇰🇪 Kenya | 74.0% |
| 32 | 🇱🇦 Laos | 74.0% |
| 33 | 🇵🇭 Philippines | 74.0% |
| 34 | 🇸🇿 Eswatini | 73.8% |
| 35 | 🇲🇲 Myanmar | 73.8% |
| 36 | 🇨🇮 Cote d'Ivoire | 72.9% |
| 37 | 🇬🇲 Gambia | 72.2% |
| 38 | 🇲🇱 Mali | 72.0% |
| 39 | 🇮🇩 Indonesia | 70.8% |
| 40 | 🇿🇦 South Africa | 66.7% |
| 41 | 🇧🇩 Bangladesh | 66.1% |
| 42 | 🇩🇯 Djibouti | 65.3% |
| 43 | 🇲🇳 Mongolia | 64.1% |
| 44 | 🇫🇯 Fiji | 63.7% |
| 45 | 🇯🇲 Jamaica | 62.6% |
| 46 | 🇲🇷 Mauritania | 62.4% |
| 47 | 🇪🇬 Egypt | 61.6% |
| 48 | 🇨🇲 Cameroon | 60.5% |
| 49 | 🇧🇼 Botswana | 60.3% |
| 50 | 🇳🇦 Namibia | 59.5% |
| 51 | 🇸🇷 Suriname | 58.6% |
| 52 | 🇰🇬 Kyrgyzstan | 58.2% |
| 53 | 🇱🇰 Sri Lanka | 55.5% |
| 54 | 🇧🇿 Belize | 53.0% |
| 55 | 🇧🇹 Bhutan | 45.2% |
| 56 | 🇸🇳 Senegal | 45.0% |
| 57 | 🇭🇳 Honduras | 44.8% |
| 58 | 🇹🇯 Tajikistan | 44.3% |
| 59 | 🇦🇲 Armenia | 41.4% |
| 60 | 🇨🇻 Cape Verde | 41.2% |
| 61 | 🇳🇮 Nicaragua | 34.2% |
| 62 | 🇩🇿 Algeria | 32.4% |
| 63 | 🇨🇴 Colombia | 31.3% |
| 64 | 🇮🇷 Iran | 30.0% |
| 65 | 🇬🇦 Gabon | 29.9% |
| 66 | 🇱🇨 Saint Lucia | 27.2% |
| 67 | 🇩🇴 Dominican Republic | 25.8% |
| 68 | 🇵🇪 Peru | 25.7% |
| 69 | 🇧🇷 Brazil | 22.4% |
| 70 | 🇻🇳 Vietnam | 21.0% |
| 71 | 🇵🇾 Paraguay | 20.4% |
| 72 | 🇲🇽 Mexico | 20.2% |
| 73 | 🇪🇨 Ecuador | 19.7% |
| 74 | 🇬🇾 Guyana | 18.5% |
| 75 | 🇮🇶 Iraq | 18.4% |
| 76 | 🇹🇭 Thailand | 18.0% |
| 77 | 🇹🇳 Tunisia | 17.1% |
| 78 | 🇵🇦 Panama | 17.0% |
| 79 | 🇦🇱 Albania | 15.9% |
| 80 | 🇲🇦 Morocco | 15.5% |
| 81 | 🇲🇰 North Macedonia | 15.5% |
| 82 | 🇵🇸 Palestine | 15.4% |
| 83 | 🇧🇴 Bolivia | 15.1% |
| 84 | 🇲🇪 Montenegro | 14.9% |
| 85 | 🇨🇷 Costa Rica | 14.2% |
| 86 | 🇲🇺 Mauritius | 14.0% |
| 87 | 🇨🇳 China | 10.9% |
| 88 | 🇷🇸 Serbia | 10.9% |
| 89 | 🇹🇹 Trinidad & Tobago | 9.9% |
| 90 | 🇸🇨 Seychelles | 7.3% |
| 91 | 🇷🇴 Romania | 7.2% |
| 92 | 🇯🇴 Jordan | 7.1% |
| 93 | 🇹🇷 Turkey | 6.0% |
| 94 | 🇺🇾 Uruguay | 5.2% |
| 95 | 🇧🇬 Bulgaria | 4.2% |
| 96 | 🇲🇩 Moldova | 3.8% |
| 97 | 🇨🇱 Chile | 3.5% |
| 98 | 🇧🇦 Bosnia & Herzegovina | 3.0% |
| 99 | 🇷🇺 Russia | 2.6% |
| 100 | 🇲🇾 Malaysia | 2.5% |
| 101 | 🇰🇿 Kazakhstan | 2.3% |
| 102 | 🇸🇰 Slovakia | 2.3% |
| 103 | 🇬🇷 Greece | 2.2% |
| 104 | 🇯🇵 Japan | 2.0% |
| 105 | 🇭🇷 Croatia | 1.8% |
| 106 | 🇪🇸 Spain | 1.8% |
| 107 | 🇭🇺 Hungary | 1.5% |
| 108 | 🇮🇹 Italy | 1.5% |
| 109 | 🇱🇻 Latvia | 1.5% |
| 110 | 🇰🇷 South Korea | 1.5% |
| 111 | 🇮🇱 Israel | 1.2% |
| 112 | 🇲🇻 Maldives | 1.2% |
| 113 | 🇵🇹 Portugal | 1.2% |
| 114 | 🇺🇸 U.S. | 1.2% |
| 115 | 🇦🇹 Austria | 0.9% |
| 116 | 🇪🇪 Estonia | 0.8% |
| 117 | 🇲🇹 Malta | 0.8% |
| 118 | 🇦🇺 Australia | 0.7% |
| 119 | 🇱🇹 Lithuania | 0.7% |
| 120 | 🇸🇪 Sweden | 0.6% |
| 121 | 🇧🇾 Belarus | 0.5% |
| 122 | 🇵🇱 Poland | 0.5% |
| 123 | 🇨🇦 Canada | 0.4% |
| 124 | 🇬🇧 UK | 0.4% |
| 125 | 🇳🇴 Norway | 0.3% |
| 126 | 🇩🇰 Denmark | 0.2% |
| 127 | 🇫🇷 France | 0.2% |
| 128 | 🇩🇪 Germany | 0.2% |
| 129 | 🇧🇪 Belgium | 0.1% |
| 130 | 🇨🇿 Czechia | 0.1% |
| 131 | 🇮🇸 Iceland | 0.1% |
| 132 | 🇮🇪 Ireland | 0.1% |
| 133 | 🇳🇱 Netherlands | 0.1% |
| 134 | 🇦🇪 UAE | 0.1% |
| 135 | 🇦🇿 Azerbaijan | 0.0% |
| 136 | 🇨🇾 Cyprus | 0.0% |
| 137 | 🇫🇮 Finland | 0.0% |
| 138 | 🇱🇺 Luxembourg | 0.0% |
| 139 | 🇸🇮 Slovenia | 0.0% |
| 140 | 🇨🇭 Switzerland | 0.0% |
At the top of the list, nearly 98% of Madagascar’s population cannot afford a healthy diet. The country is facing a prolonged drought in the southern region since 2019, affecting agriculture. A series of cyclones in 2021–2022 destroyed rice fields and damaged critical infrastructure, like road networks, putting further pressure on food prices. Finally, the rising price of oil due to the Russian invasion has pushed up transport costs. All these factors have resulted in food prices jumping nearly 20% in three years.
As a result, food insecurity in Madagascar has risen dramatically—by nearly one million people every year since 2019, of which 250,000 are classified under a “famine situation.”
A mix of similar factors affect the next five countries with the highest share of population unable to afford food—Burundi, Malawi, Central African Republic, Nigeria, and Liberia.
In Haiti, ranked 7th, a reliance on food imports makes the country vulnerable to inflation and price volatility, which has been markedly worse in the last two years.
On the other hand, predictably, the top five countries with the least food unaffordability—Cyprus, Finland, Luxembourg, Slovenia, and Switzerland—are all from Europe with 0% of the population unable to afford a healthy diet.

Geographically, eight out of 10 people in sub-Saharan Africa and seven out of 10 people in South Asia cannot afford a healthy diet versus three out of 10 in Europe and one out of 10 in North America.
When reducing the quality of diet, food becomes a little more affordable.
For example, in Indonesia, nearly 71% of the population cannot afford a healthy diet. However this drops to 64% for a nutrient-sufficient diet, and only 3% for a calorie-sufficient diet.
| Country | Can't Afford a Healthy Diet | Can't Afford a Nutrient-Sufficient Diet | Can't afford a Calorie-Sufficient Diet |
|---|---|---|---|
| 🇦🇱 Albania | 15.9% | 8.9% | 0.0% |
| 🇩🇿 Algeria | 32.4% | 6.2% | 0.1% |
| 🇦🇴 Angola | 88.0% | 71.1% | 36.0% |
| 🇦🇷 Argentina | N/A | 4.0% | 0.2% |
| 🇦🇲 Armenia | 41.4% | 14.3% | 0.5% |
| 🇦🇺 Australia | 0.7% | 0.5% | 0.2% |
| 🇦🇹 Austria | 0.9% | 0.5% | 0.2% |
| 🇦🇿 Azerbaijan | 0.0% | 0.0% | 0.0% |
| 🇧🇩 Bangladesh | 66.1% | 48.6% | 0.6% |
| 🇧🇾 Belarus | 0.5% | 0.2% | 0.0% |
| 🇧🇪 Belgium | 0.1% | 0.3% | 0.1% |
| 🇧🇿 Belize | 53.0% | 57.0% | 19.6% |
| 🇧🇯 Benin | 82.6% | 81.9% | 13.7% |
| 🇧🇹 Bhutan | 45.2% | 26.2% | 0.7% |
| 🇧🇴 Bolivia | 15.1% | 19.1% | 6.8% |
| 🇧🇦 Bosnia & Herzegovina | 3.0% | 2.4% | 0.0% |
| 🇧🇼 Botswana | 60.3% | 44.3% | 1.3% |
| 🇧🇷 Brazil | 22.4% | 18.1% | 3.5% |
| 🇧🇬 Bulgaria | 4.2% | 6.3% | 0.3% |
| 🇧🇫 Burkina Faso | 77.6% | 76.2% | 5.4% |
| 🇧🇮 Burundi | 95.9% | 84.1% | 41.5% |
| 🇨🇲 Cameroon | 60.5% | 48.6% | 15.7% |
| 🇨🇦 Canada | 0.4% | 0.5% | 0.0% |
| 🇨🇻 Cape Verde | 41.2% | 29.7% | 0.3% |
| 🇨🇫 Central African Republic | 94.6% | 83.3% | 67.0% |
| 🇹🇩 Chad | 83.1% | 60.6% | 11.3% |
| 🇨🇱 Chile | 3.5% | 1.6% | 0.2% |
| 🇨🇳 China | 10.9% | 9.7% | 0.2% |
| 🇨🇴 Colombia | 31.3% | 20.3% | 3.5% |
| 🇨🇬 Congo | 91.5% | 80.8% | 39.9% |
| 🇨🇷 Costa Rica | 14.2% | 7.8% | 0.7% |
| 🇨🇮 Cote d'Ivoire | 72.9% | 39.6% | 8.4% |
| 🇭🇷 Croatia | 1.8% | 3.3% | 0.3% |
| 🇨🇾 Cyprus | 0.0% | 0.1% | 0.0% |
| 🇨🇿 Czechia | 0.1% | 0.1% | 0.0% |
| 🇨🇩 DRC | 85.5% | 86.9% | 27.9% |
| 🇩🇰 Denmark | 0.2% | 0.2% | 0.1% |
| 🇩🇯 Djibouti | 65.3% | 59.0% | 5.6% |
| 🇩🇴 Dominican Republic | 25.8% | 15.8% | 1.3% |
| 🇪🇨 Ecuador | 19.7% | 14.8% | 4.4% |
| 🇪🇬 Egypt | 61.6% | 33.5% | 1.0% |
| 🇪🇪 Estonia | 0.8% | 0.8% | 0.2% |
| 🇸🇿 Eswatini | 73.8% | 64.4% | 26.6% |
| 🇪🇹 Ethiopia | 83.8% | 62.7% | 7.7% |
| 🇫🇯 Fiji | 63.7% | 21.3% | 0.2% |
| 🇫🇮 Finland | 0.0% | 0.1% | 0.1% |
| 🇫🇷 France | 0.2% | 0.0% | 0.0% |
| 🇬🇦 Gabon | 29.9% | 16.3% | 1.3% |
| 🇬🇲 Gambia | 72.2% | 63.9% | 10.6% |
| 🇩🇪 Germany | 0.2% | 0.7% | 0.2% |
| 🇬🇭 Ghana | 77.4% | 62.9% | 14.9% |
| 🇬🇷 Greece | 2.2% | 2.5% | 0.5% |
| 🇬🇳 Guinea | 89.1% | 61.6% | 8.6% |
| 🇬🇼 Guinea-Bissau | 84.6% | 59.7% | 18.3% |
| 🇬🇾 Guyana | 18.5% | 31.7% | 4.4% |
| 🇭🇹 Haiti | 92.6% | 73.8% | 23.5% |
| 🇭🇳 Honduras | 44.8% | 49.9% | 14.3% |
| 🇭🇺 Hungary | 1.5% | 1.9% | 0.3% |
| 🇮🇸 Iceland | 0.1% | 0.0% | 0.0% |
| 🇮🇳 India | 74.1% | 64.0% | 3.2% |
| 🇮🇩 Indonesia | 70.8% | 7.0% | 4.3% |
| 🇮🇷 Iran | 30.0% | 5.0% | 0.2% |
| 🇮🇶 Iraq | 18.4% | 5.8% | 0.1% |
| 🇮🇪 Ireland | 0.1% | 0.3% | 0.2% |
| 🇮🇱 Israel | 1.2% | 1.2% | 0.2% |
| 🇮🇹 Italy | 1.5% | 2.1% | 1.0% |
| 🇯🇲 Jamaica | 62.6% | 36.6% | 0.9% |
| 🇯🇵 Japan | 2.0% | 1.4% | 1.2% |
| 🇯🇴 Jordan | 7.1% | 0.1% | 0.0% |
| 🇰🇿 Kazakhstan | 2.3% | 0.5% | 0.0% |
| 🇰🇪 Kenya | 74.0% | 57.0% | 11.6% |
| 🇰🇬 Kyrgyzstan | 58.2% | 38.9% | 0.7% |
| 🇱🇦 Laos | 74.0% | 61.1% | 0.8% |
| 🇱🇻 Latvia | 1.5% | 1.7% | 0.2% |
| 🇱🇸 Lesotho | 87.9% | 63.3% | 10.7% |
| 🇱🇷 Liberia | 92.8% | 82.7% | 20.2% |
| 🇱🇹 Lithuania | 0.7% | 1.6% | 0.8% |
| 🇱🇺 Luxembourg | 0.0% | 0.4% | 0.1% |
| 🇲🇬 Madagascar | 97.8% | 96.0% | 78.3% |
| 🇲🇼 Malawi | 95.9% | 83.2% | 2.4% |
| 🇲🇾 Malaysia | 2.5% | 0.9% | 0.0% |
| 🇲🇻 Maldives | 1.2% | 0.6% | 0.0% |
| 🇲🇱 Mali | 72.0% | 57.5% | 1.9% |
| 🇲🇹 Malta | 0.8% | 0.3% | 0.1% |
| 🇲🇷 Mauritania | 62.4% | 48.3% | 2.7% |
| 🇲🇺 Mauritius | 14.0% | 4.4% | 0.0% |
| 🇲🇽 Mexico | 20.2% | 17.2% | 0.7% |
| 🇲🇩 Moldova | 3.8% | 0.3% | 0.0% |
| 🇲🇳 Mongolia | 64.1% | 14.4% | 0.1% |
| 🇲🇪 Montenegro | 14.9% | 9.1% | 1.6% |
| 🇲🇦 Morocco | 15.5% | 6.5% | 0.0% |
| 🇲🇿 Mozambique | 92.5% | 83.3% | 13.2% |
| 🇲🇲 Myanmar | 73.8% | 42.7% | 0.7% |
| 🇳🇦 Namibia | 59.5% | 33.6% | 13.9% |
| 🇳🇵 Nepal | 76.4% | 51.0% | 2.6% |
| 🇳🇱 Netherlands | 0.1% | 0.3% | 0.0% |
| 🇳🇮 Nicaragua | 34.2% | 21.2% | 5.7% |
| 🇳🇪 Niger | 92.0% | 77.1% | 13.6% |
| 🇳🇬 Nigeria | 93.5% | 69.4% | 44.4% |
| 🇲🇰 North Macedonia | 15.5% | 16.8% | 2.6% |
| 🇳🇴 Norway | 0.3% | 0.5% | 0.3% |
| 🇵🇰 Pakistan | 82.8% | 40.9% | 0.3% |
| 🇵🇸 Palestine | 15.4% | 2.4% | 0.6% |
| 🇵🇦 Panama | 17.0% | 12.1% | 2.2% |
| 🇵🇾 Paraguay | 20.4% | 24.4% | 0.5% |
| 🇵🇪 Peru | 25.7% | 16.5% | 2.7% |
| 🇵🇭 Philippines | 74.0% | 53.1% | 6.9% |
| 🇵🇱 Poland | 0.5% | 0.1% | 0.0% |
| 🇵🇹 Portugal | 1.2% | 0.7% | 0.1% |
| 🇷🇴 Romania | 7.2% | 8.0% | 0.9% |
| 🇷🇺 Russia | 2.6% | 0.8% | 0.0% |
| 🇷🇼 Rwanda | 82.0% | 61.3% | 28.1% |
| 🇱🇨 Saint Lucia | 27.2% | 16.7% | 4.6% |
| 🇸🇹 Sao Tome & Principe | 78.2% | 63.4% | 8.0% |
| 🇸🇳 Senegal | 45.0% | 43.2% | 3.3% |
| 🇷🇸 Serbia | 10.9% | 14.3% | 3.2% |
| 🇸🇨 Seychelles | 7.3% | 2.5% | 0.1% |
| 🇸🇱 Sierra Leone | 83.5% | 73.3% | 34.9% |
| 🇸🇰 Slovakia | 2.3% | 1.4% | 0.1% |
| 🇸🇮 Slovenia | 0.0% | 0.0% | 0.0% |
| 🇿🇦 South Africa | 66.7% | 60.3% | 24.2% |
| 🇰🇷 South Korea | 1.5% | 1.5% | 0.0% |
| 🇪🇸 Spain | 1.8% | 1.0% | 0.5% |
| 🇱🇰 Sri Lanka | 55.5% | 22.8% | 0.6% |
| 🇸🇩 Sudan | 85.4% | 58.7% | 15.3% |
| 🇸🇷 Suriname | 58.6% | 34.2% | 15.8% |
| 🇸🇪 Sweden | 0.6% | 0.4% | 0.2% |
| 🇨🇭 Switzerland | 0.0% | 0.0% | 0.0% |
| 🇹🇼 Taiwan | N/A | 0.2% | 0.0% |
| 🇹🇯 Tajikistan | 44.3% | 33.3% | 2.3% |
| 🇹🇿 Tanzania | 85.0% | 75.6% | 36.8% |
| 🇹🇭 Thailand | 18.0% | 7.0% | 0.0% |
| 🇹🇹 Trinidad & Tobago | 9.9% | 3.4% | 0.2% |
| 🇹🇳 Tunisia | 17.1% | 1.9% | 0.0% |
| 🇹🇷 Turkey | 6.0% | 3.1% | 0.0% |
| 🇺🇬 Uganda | 81.7% | 68.9% | 13.9% |
| 🇦🇪 UAE | 0.1% | 0.0% | 0.0% |
| 🇬🇧 UK | 0.4% | 0.5% | 0.2% |
| 🇺🇸 U.S. | 1.2% | 1.5% | 1.2% |
| 🇺🇾 Uruguay | 5.2% | 0.8% | 0.0% |
| 🇻🇳 Vietnam | 21.0% | 11.7% | 0.7% |
| 🇿🇲 Zambia | 90.0% | 82.5% | 65.1% |
| 🇿🇼 Zimbabwe | N/A | 10.6% | 0.0% |
| 🌐 World | 42.20% | 31.90% | 4.90% |
While the aim is to have every single person able to afford a healthy diet, it is useful to track progress across diets to see which countries are making strides in food affordability, whether it comes from growing incomes or improved supply.
At a regional level, these nuances reveal geographic differences in food unaffordability.

While sub-Saharan Africa and South Asia have comparable shares of population unable to afford healthy and nutrient sufficient diets, the gap widens immensely when looking at just calorie-sufficient diets, nearly 25% versus 2.6%.
For countries in South Asia, this could help target efforts to improve affordability for more than the most basic of diets.
I. Don’t. Care!!
See my tag line.
Paging Sam Kinison
BTTT
I don’t care about what the rest of the world is paying for groceries. I do know that four years ago I could get a shopping cart full of groceries for about $60 dollars. Now that same shopping cart full of groceries is about $100 dollars. Toilet paper, laundry detergent, milk,bacon, all of it has gone up in price.
Not covid19 and ukraine.
More like lies and manipulation of people and food supplies and supply chains (ie: destroying factories, processing plants, food sources, etc)
A “Citizen of the World” might feel their pain, however insincerely.
Covid created to get Donald Trump out of office and war in Ukraine directly a result because he was out of office along with much higher oil prices and the rest of the ill effects of having Obama back in the White House. The left has done a marvelous job of bringing more ruin to the world.
Bkmk
Africa population has been around longer than North America. Why are they so backwards in everything? I would vote for the type of government they have is holding them back.
I always wondered why that was. You would think that this would be where most of the food is concentrated as the climate favors year crop cycles.
At $17.50 a pound for a piece of sirloin I can only dream about it.
Disclaimer: Opinions posted on Free Republic are those of the individual posters and do not necessarily represent the opinion of Free Republic or its management. All materials posted herein are protected by copyright law and the exemption for fair use of copyrighted works.