
Posted on 01/08/2022 7:35:40 PM PST by MinorityRepublican
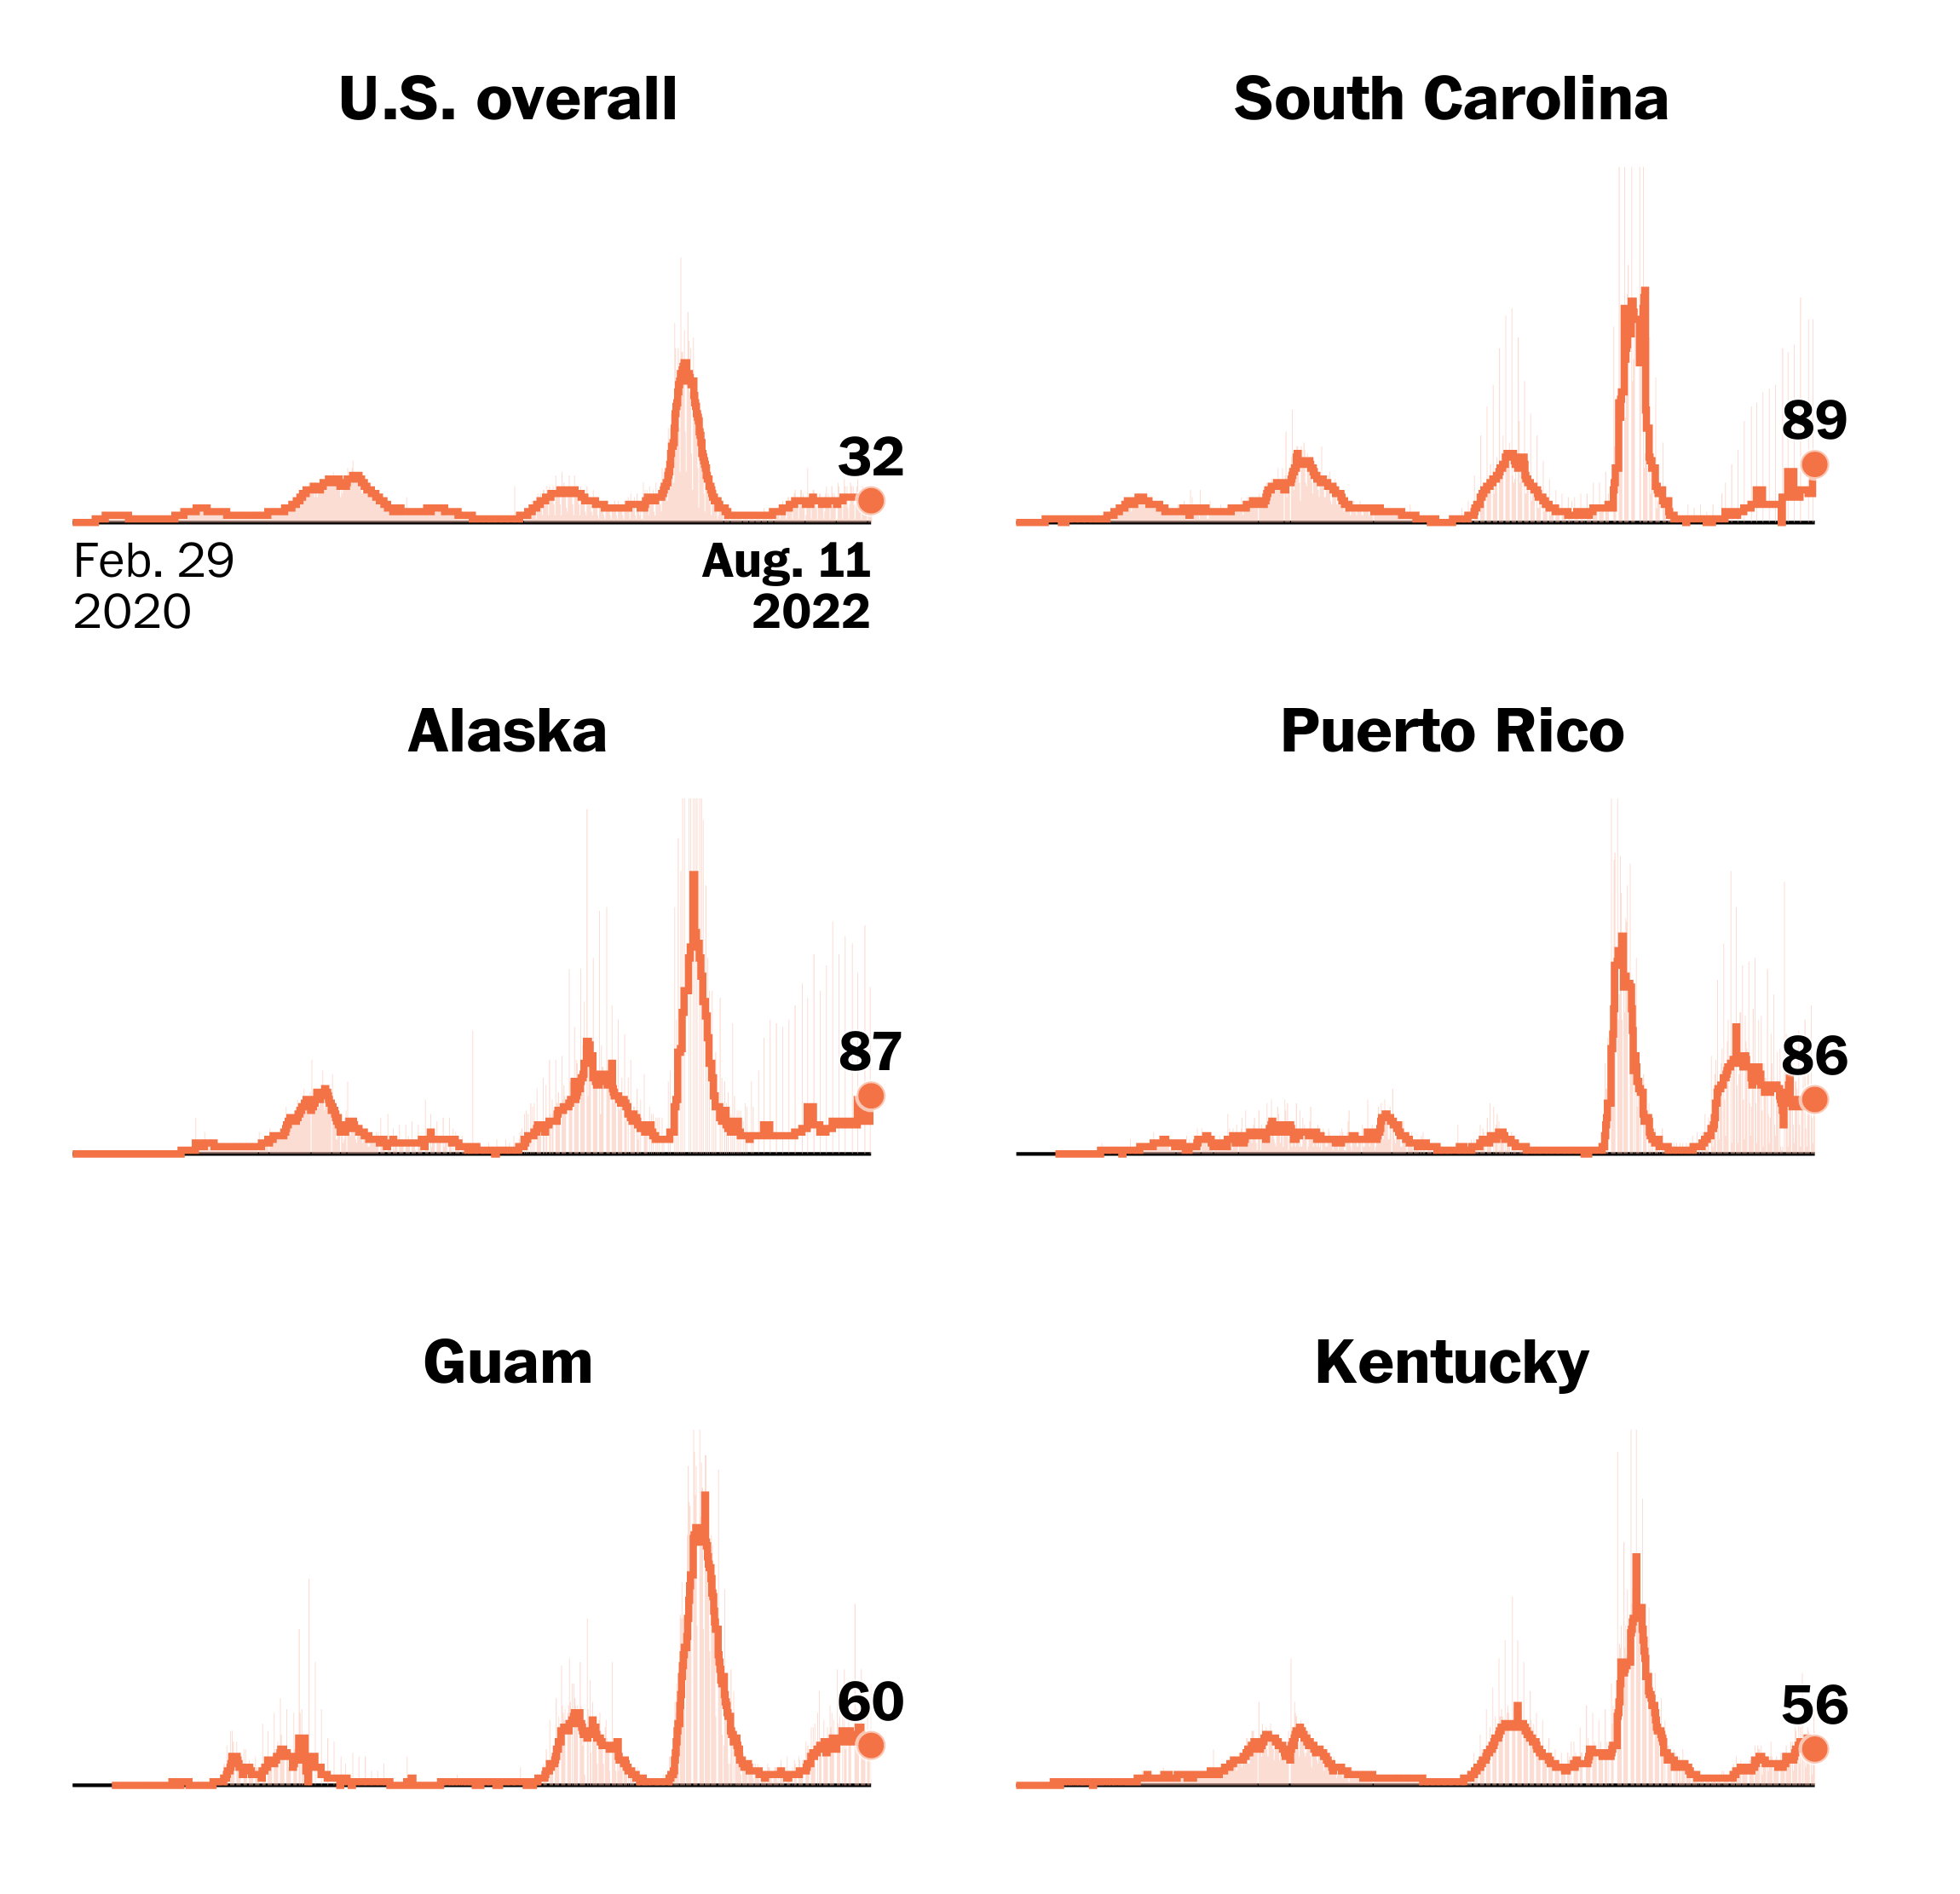
Places with highest daily reported cases per capita
Seven-day average of daily new reported cases per 100,000 residents

Data Source: U.S. Department of Health & Human Services
Just like with crime, the highest places are demonrat places!
Jan 1 to Jan 7 . . . is this yesterday’s data?
Impossible! Joe had a plan!
Local Houston & Texas News
More Proof That The Covid Death Stats Are Greatly Exaggerated
By B.D. Hobbs
Jun 10, 2021
In yet another story that you won’t hear about from the mainstream media, counties across the country are lowering the Covid death toll numbers.
It turns out, every single death during the pandemic was -not- due to the Corona virus.
“We knew right from the beginning this would happen” said Dr. Richard Urso, an infectious disease specialist. “I’m not surprised to see the numbers down.”
Another factor is that they changed the protocol coincidentally, right after Joe Biden took office. One county in liberal California, just lowered it’s death toll by 25%.
During 2020, while Donald Trump was still in office, pretty much every single death was attributed to Covid. Old age, cancer, even the infamous story of a guy who was killed in a motorcycle crash, but they said it was due to Covid-19.
“Clearly that was misconstrued data” Dr. Urso told KTRH, “They were misdiagnosing people, and this was happening over and over and over.”
Russia will be happy to hear that all those people they reported dead are not dead — because it was all a US political spat.
Its methods strike me as entirely haphazard, and I think the CDC supplies it with data and then uses Worldometer as a 'unbiased source' to then base its own statements about the overtaxxed medical system (circular reporting).
Here are two examples of the overall inaccurate plandemic reporting 'system'.
And FReeper SeekAndFind points to still another indication the statistics are not accurate:
What Is the Death Rate of Omicron? It’s WAY Less Than You Think
PJ Media ^ | 01/07/2022 | Matt Margolis
Posted on 1/7/2022, 10:13:31 PM by SeekAndFind
Wow, what a ride on this Omicron wave.
I heard the shape of its curve described as an “ice pick”.
It is expected to come down about the same way, after peaking.
I believe that three hard weeks of explosive growth, in the BOOM phase of spread, is what they had in Johannesburg and London. So that is the default expectation here in States as well. If so, we should start seeing clear declines in some of the earliest hotspots that BOOMed first, this coming week.
NYC and DC trend lines seem to have inflected strongly in recent days.
Hitting test capacity constraints will probably look like a plateau but the real cresting of an Omicron wave will likely show steep declines, similar to the way up.
Disclaimer: Opinions posted on Free Republic are those of the individual posters and do not necessarily represent the opinion of Free Republic or its management. All materials posted herein are protected by copyright law and the exemption for fair use of copyrighted works.