
Spain: IFRs by age group and gender in confirmed cases (Source)
Posted on 10/11/2020 9:01:07 AM PDT by SeekAndFind
1) Antibody studies ⇓ 2) Immunological studies ⇓ 3) Median age of death ⇓ 4) Hospitalizations ⇓ 5) Nursing homes ⇓ 6) Overall mortality ⇓ 7) Development ⇓ IFR: Infection fatality rate
The covid-19 infection fatality rate (IFR) depends on demographics (age and risk structure), public policies (e.g. protection of nursing homes), and medical treatment quality.
Covid-19 IFRs are strongly age-dependent, with a steep increase above the age of 70. The median age of covid-related deaths in most Western countries is 80 to 86 years (see section 3 below). In most Western countries, about half of all deaths occurred in nursing homes (see section 5).
In terms of covid-19 IFRs, an important difference exists between places with and without a partial or total collapse of local health and elderly care, and between the early and late pandemic phase.
| Country | Published | Population | IFR (%) | Source |
| Global | October 5 | WHO estimate (global average) |
0.136 | WHO |
| Japan | Sept. 23 | Tokyo | 0.01 | Hibino |
| USA | Sept. 2 | Indiana | 0.265 | AIM |
| Brazil | Sept. 1 Sept. 21 |
Maranhao Manaus |
0.17 0.28 |
da Silva Buss |
| Iceland | Sept. 1 | General population Below 70 years |
0.30 0.10 |
NEJM |
| Switzerland | July 14 August 7 |
Geneva hotspot Zurich area |
0.32¹ 0.30¹ |
Perez Aguzzi |
| India | July 31 | Delhi Mumbai |
0.07² 0.12² |
India |
| Africa | July 29 August 5 |
Kenya Malawi |
0.01 0.01 |
Uyoga Grace |
| Global | July 14 | 50 studies Below 70 years |
0.24³ 0.04³ |
Ioannidis |
| Austria | June 25 | Ischgl hotspot | 0.26 | von Laer |
| Sweden | June 16 | Stockholm NNH Stockholm <70y |
0.357 0.09 |
FOHM |
| Slovenia | May 6 | General population | 0.16 | GSI |
| Germany | May 4 | Heinsberg hotspot | 0.364 | Streeck |
| Iran | May 1 | Guilan province | 0.12 | Shakiba |
| USA | April 30 April 24 April 21 |
Santa Clara County Miami-Dade County Los Angeles County |
0.17 0.18 0.20 |
Bendavid Miami Sood |
| Denmark | April 28 | Blood donors (<70y) | 0.08 | Erikstrup |
1) 0.64% and 0.60% including nursing homes; 2) 0.14% and 0.23% assuming 40% missing fatalities (more); 3) median values; 4) the unadjusted IFR is 0.28% (page 9); 5) general population (excl. nursing homes); 6) one million deaths and 760 million infections (WHO global estimate); 7) 0.58% including Stockholm nursing homes (about 40% of deaths, see page 23).
Note: The much-cited Meyerowitz-Katz meta-study claiming a global Covid-19 IFR of 0.68% is misleading because it mixes modelling studies and antibody studies, nursing homes and the general population, early and late phase IFRs, and commits several methodological mistakes.
Overview: 1) Spain; 2) Northern Italy; 3) New York City; 4) England; 5) Belgium
Places with a partial or total collapse of local health and eldery care experienced significantly higher and very strongly age-dependent IFR values, especially during the early phase of the pandemic.
However, IgG antibody tests may underestimate the true prevalence of coronavirus infections and may thus overestimate the IFR by a factor of two to five (see section 2 below).
| Country | Published | Population | IFR (%) | Source |
| Spain | August 7 | Covid confirmed Excess deaths Below 50 years Below 40 years |
0.82 1.07 <0.10 <0.03 |
Pollan |
A Spanish seroprevalence study found an overall IFR between 0.82% (based on confirmed Covid-19 deaths) and 1.07% (based on excess all-cause deaths). The study didn’t include nursing homes, which accounted for about 50% of all deaths. The IFR was strongly age-dependent, with values below 0.03% until 40 and below 0.1% until 50 but reaching very high levels above 70 years.
The study found a country-wide IgG antibody seroprevalence of just 4.9% (about 12% in Madrid). However, less than 20% of symptomatic people (3+ symptoms or anosmia) had IgG antibodies. This may indicate that infections were up to five times more widespread than detected by IgG antibody tests (see section 2 below on this topic). If so, Spanish IFR values might drop below 0.5%.
Above 60 years, there was a significant difference in lethality between men and women. This might be due to e.g. genetic reasons, cardiovascular health, or certain habits like smoking.
Spain: IFRs by age group and gender in confirmed cases (Source)
| Country | Published | Population | IFR (%) | Source |
| Northern Italy | August 6 | Above 70 years Below 70 years Below 50 years 80+, first phase 80+, second ph. |
10.5 0.43 <0.01 30.40 8.10 |
Poletti |
An Italian study considered contacts of confirmed Covid-19 cases in the Lombardy region, which includes hotspots like Bergamo and Cremona, to determine their fatality risk and their comorbidities. They found that the overall IFR was 62% lower in the second phase of the pandemic (after March 16) compared to the first, cataclysmic phase (up to March 15).
This was particularly evident in people above 80, where the IFR dropped from 30% in the early phase to 8% in the later phase (4% for women, 16% for men). Below 50 years, IFRs were near 0%; below 70 years, IFRs were 0.43% (both phases combined). More than 80% of deaths occurred in patients with cardiovascular diseases, which are known to be an important risk factor.
Of note, among Italian people with anosmia (temporary loss of the sense of smell or taste), a very typical Covid symptom, only about 25% were found to have IgG antibodies. This could indicate that coronavirus infections are more widespread, and IFRs lower, than assumed.
Northern Italy: IFRs in early and late pandemic phase (Source)
| City | Published | Population | IFR (%) | Source |
| New York City | June 29 | Overall | 0.70 | Stadlbauer |
| New York City | June 29 | Confirmed Probable 25 to 44 y. <25 years |
1.10 1.45 0.12 0.01 |
Yang |
Until May 2020, New York City counted about 20,000 confirmed and probable Covid-19 deaths among its 8.4 million citizens and registered an antibody prevalence of about 20%. Studies estimating the infection fatality rate (IFR) for New York City found values between 0.7% and 1.1% based on confirmed deaths and up to 1.45% based on confirmed and probable deaths.
About 52% of Covid deaths in NYC occurred in the 75+ age group. This value is lower than in Europe, where about 90% of deaths were 70+. In all of New York State, about 6,300 patients were sent from hospitals into nursing homes, which ultimately registered between 6,600 and 13,000 deaths.
As in Italy and other hard-hit places, the IFR for age groups above 65 dropped by about 50% during the course of the pandemic, possibly due to better medical preparedness and treatment strategies.
Assuming that serological IgG antibody tests do not capture the full extent of coronavirus infections (e.g. due to mild cases without IgG antibodies), the overall IFR in New York City might drop to about 0.50% or below, and the actual spread of the coronavirus might be above 50%.
Covid deaths in NYC by age group (Source: NYC.gov)
| Country | Published | Population | IFR (%) | Study |
| England | August 21 | July 28 (MCT) July 28 (ONS) |
0.30 0.49 |
CEBM |
| England | August 14 | General population Incl. care homes 45 to 64 years Below 44 years |
0.90 1.43 0.50 0.03 |
Ward |
Until July 2020, England counted about 30,000 Covid deaths in the general population and about 20,000 Covid-related deaths in nursing homes (which had to receive patients). According to the Oxford Centre for Evidence-Based Medicine, the Covid IFR fell by 50% to 80% during the epidemic and reached a value between 0.3% and 0.5% by the end of July.
A study by Imperial College London estimated an IgG antibody seroprevalence of 6% overall and 13% in London by mid-July. However, according to Public Health England, London blood donors had an antibody seroprevalence of 17.5% already in May.
Of note, only about 50% of people with anosmia (temporary loss of the sense of smell or taste), a very typical Covid symptom, had IgG antibodies. Only 35% of people who were suspected to be Covid cases by a doctor, had IgG antibodies. And only 28% of people who self-reported “severe symptoms” had detectable IgG antibodies against SARS-CoV-2.
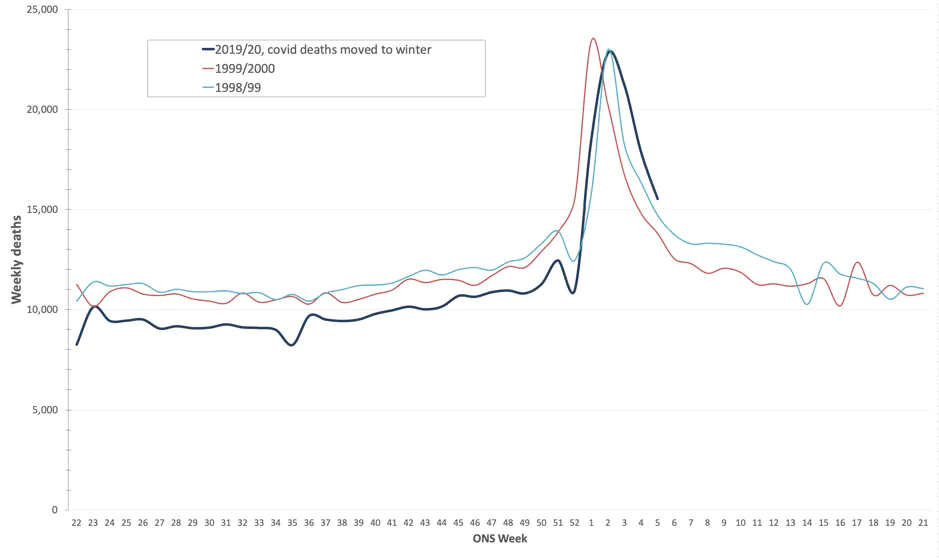
If some of these people were indeed Covid cases (without detectable antibodies at the time of testing), the overall IFR value in the general population may drop to about 0.50% or below. The overall mortality of 2020 is comparable to the strong flu season of 1999/2000 (see below).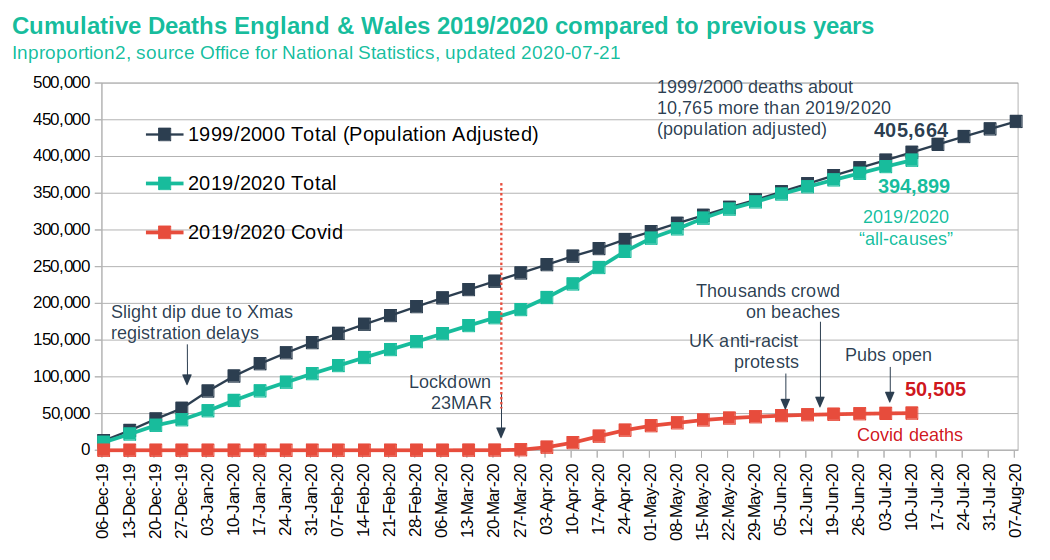
England: Mortality 2020 compared to strong flu wave of 1999/2000 (Source)
| Country | Published | Population | IFR (%) | Study |
| Belgium | June 20 | General population Incl. care homes 45 to 64 years Below 44 years |
0.43 1.25 0.21 0.02 |
Molenberghs |
Belgium reported one of the highest Covid death rates in Europe, in part because it always included confirmed and probable Covid deaths. 66% of excess deaths in Belgium occurred in nursing homes. Of these, only about a third were confirmed by a PCR test. It is possible that some of the non-confirmed nursing home deaths were not due to Covid, but due to the extreme circumstances.
Due to the high proportion of nursing home deaths, IFRs differ markedly between the general population and the nursing home population. The IFR for the general population is estimated between 0.30% to 0.62%, while the IFR for the nursing home population is estimated between 28% and 45%. For people aged 45 to 64, the IFR is 0.21, and for people aged 25 to 44, the IFR is 0.02%.
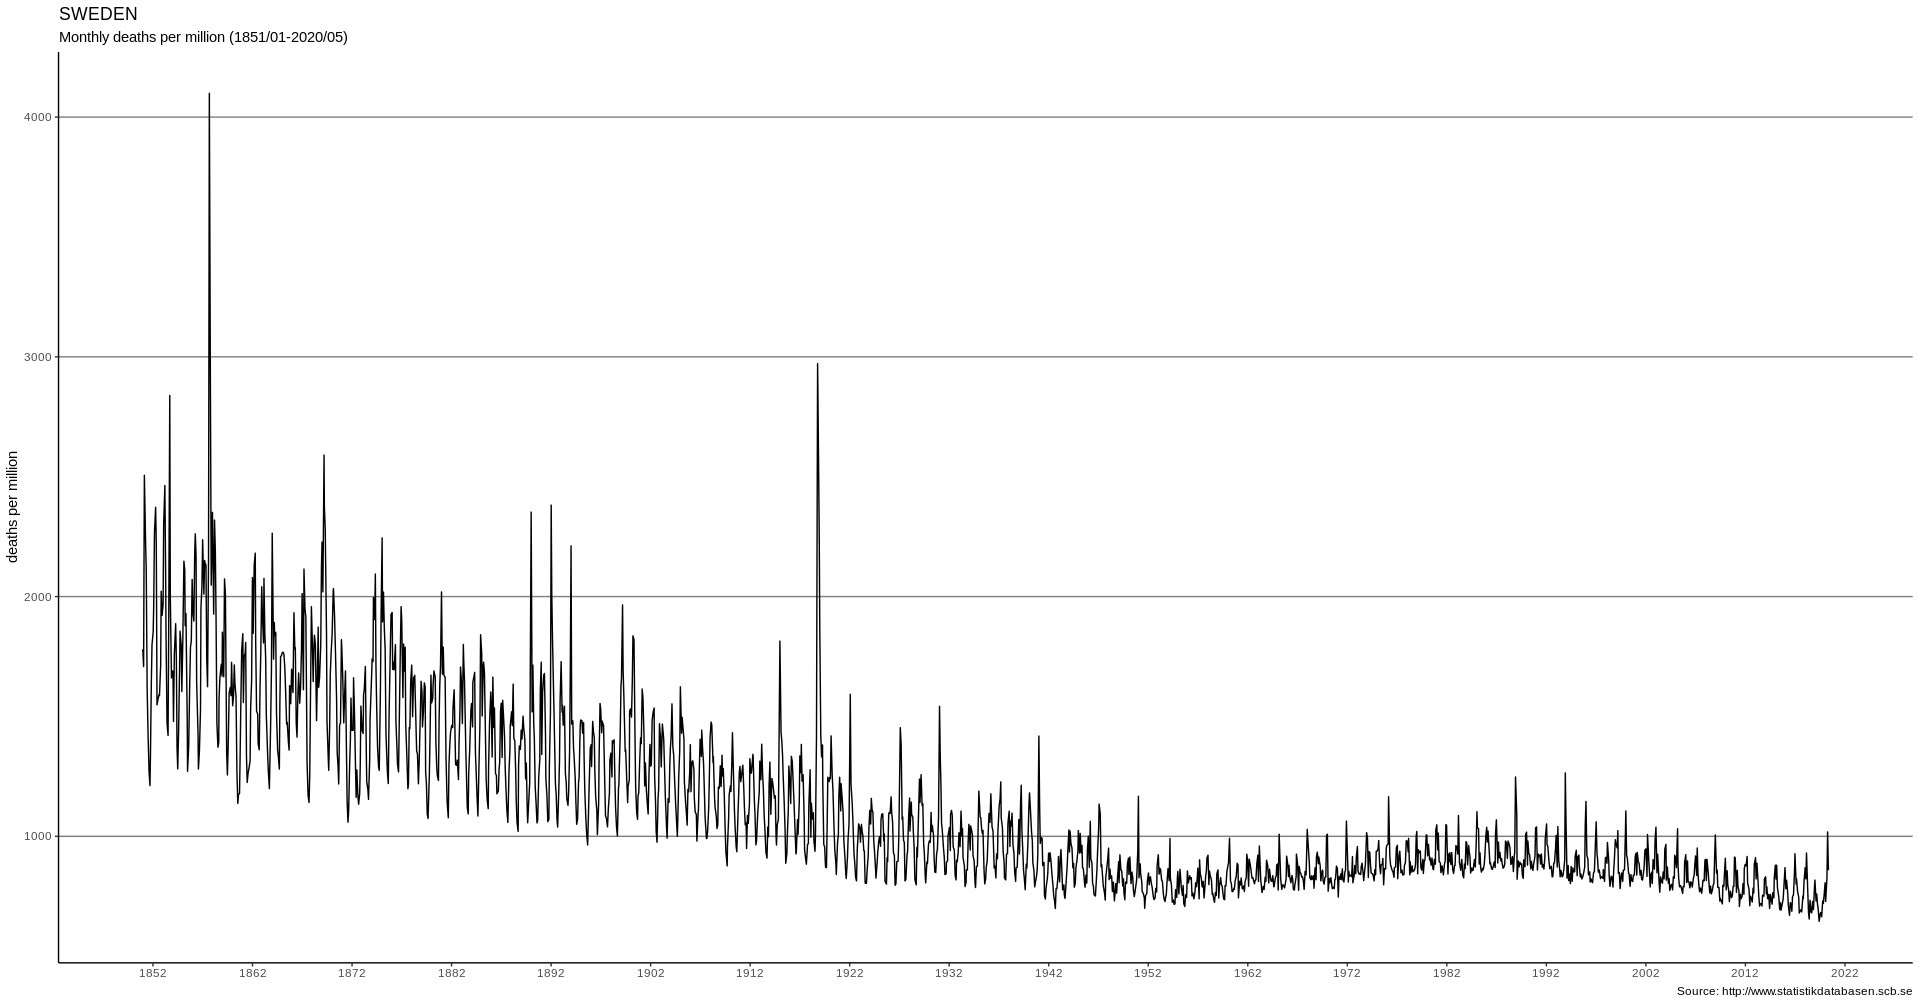
Even without age-adjustment, the number of excess deaths due to Covid in April 2020 is comparable to the number of excess deaths in January 1951 and February 1960 due to strong seasonal influenza.
Belgium reported an overall IgG antibody seroprevalence of about 6% by May 2020. If actual infections are more widespread (including mild cases without IgG), the IFR in the general population might drop below 0.30%. As in other countries, above 65 IFRs are higher for males than females.
Belgium: IFR by gender and age in (non) nursing home population (Source)
Immunological research indicates that serological antibody studies, which measure antibodies in the blood (mostly IgG), may detect only about 20% to 80% of all coronavirus infections, depending on the sensitivity of the assay, the timing of the test, and the population tested.
This is because up to 80% of people develop no symptoms or only mild symptoms if infected, as they neutralize the coronavirus with their mucosal (IgA) or cellular (T-cells) immune system. These people may develop no measurable IgG antibodies or may show them only for a few weeks.
Most global Covid-19 hotspots peaked at about 20% IgG antibody prevalence (e.g. New York City, London, Stockholm, Madrid, Bergamo). Moreover, among people with anosmia (temporary loss of the sense of taste or smell) – a very typical Covid-19 symptom – only about 20% to 50% had detectable IgG antibodies, according to surveys in several countries (see below).
See also: Are we underestimating seroprevalence of SARS-CoV-2? (BMJ, 09/2020) and Coronavirus up to five times more common and less deadly than assumed (SZ, 06/2020).
| Country | Published | Focus | Factor | Source |
| Switzerland | May 23 | IgA | 5 | Report / Study |
| China | June 16 | IgG | 6 | Study¹ |
| Sweden | June 29 | T-cells | 2 | Study |
| Spain | July 6 | IgG | 5 | Study² |
| Germany | July 16 | IgG | 2 | Study |
| Italy | August 3 | IgG | 4 | Study² |
| Brazil | August 12 | IgG | 5 | Study² |
| UK | August 14 | IgG | 2 | Study² |
1) Only 16% of likely infected HCW had IgG; 2) People with anosmia but without IgG antibodies.
Half of all deaths were below, half were above the median age.
| Country | Median age |
Source |
| Australia | 82 years | DOH |
| Austria | 80+ years | EMS |
| Canada | 86 years | HCSC |
| England | 80+ years | NHS |
| France | 84 years | SPF |
| Germany | 82 years | RKI |
| Italy | 82 years | ISS |
| Spain | 82 years | MDS |
| Sweden | 84 years | FOHM |
| Switzerland | 84 years | BAG |
| USA | 78 years | CDC |

Initial estimates based on Chinese data assumed a very high 20% hospitalization rate, which led to the strategy of ‘flattening the curve’ to avoid overburdening hospitals. However, population-based antibody studies (see above) have since shown that actual hospitalization rates are close to 1%, which is within the range of hospitalization rates for influenza (1 to 2%).
The US CDC found that Covid-19 hospitalization rates for people aged 65 and over are “within ranges of influenza hospitalization rates”, with rates slightly higher for people aged 18 to 64 and “much lower” (compared to influenza) for people under 18.
In local hotspots like New York City, the overall hospitalization rate based on antibody studies is about 2.5% (19.9% or 1.7 million people with antibodies and 43,000 hospitalizations by May 2).
The much lower than expected hospitalization rate may explain why most Covid-19 ‘field hospitals’ even in hard-hit countries like the US, the UK and China remained largely empty.
In many countries, deaths in care homes account for 30 to 60% of all additional deaths. In Canada and some US states, care homes account for up to 80% of all “Covid19-related” deaths. In Sweden, deaths in nursing homes plus nursing apartments account for 75% of all deaths.
Care home deaths: absolute numbers (bars, left scale) and percentages (dots, right scale)
Source: Mortality associated with COVID-19 outbreaks in care homes (LTC Covid, May 21, 2020)
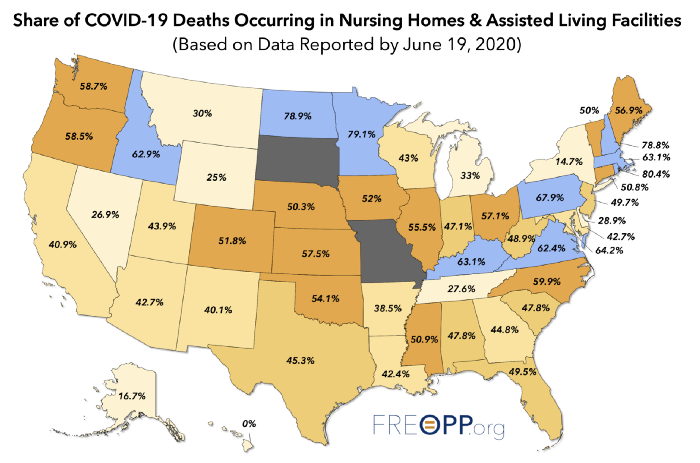
Source: The Covid-19 Nursing Home Crisis by The Numbers (Freopp, June 19, 2020)
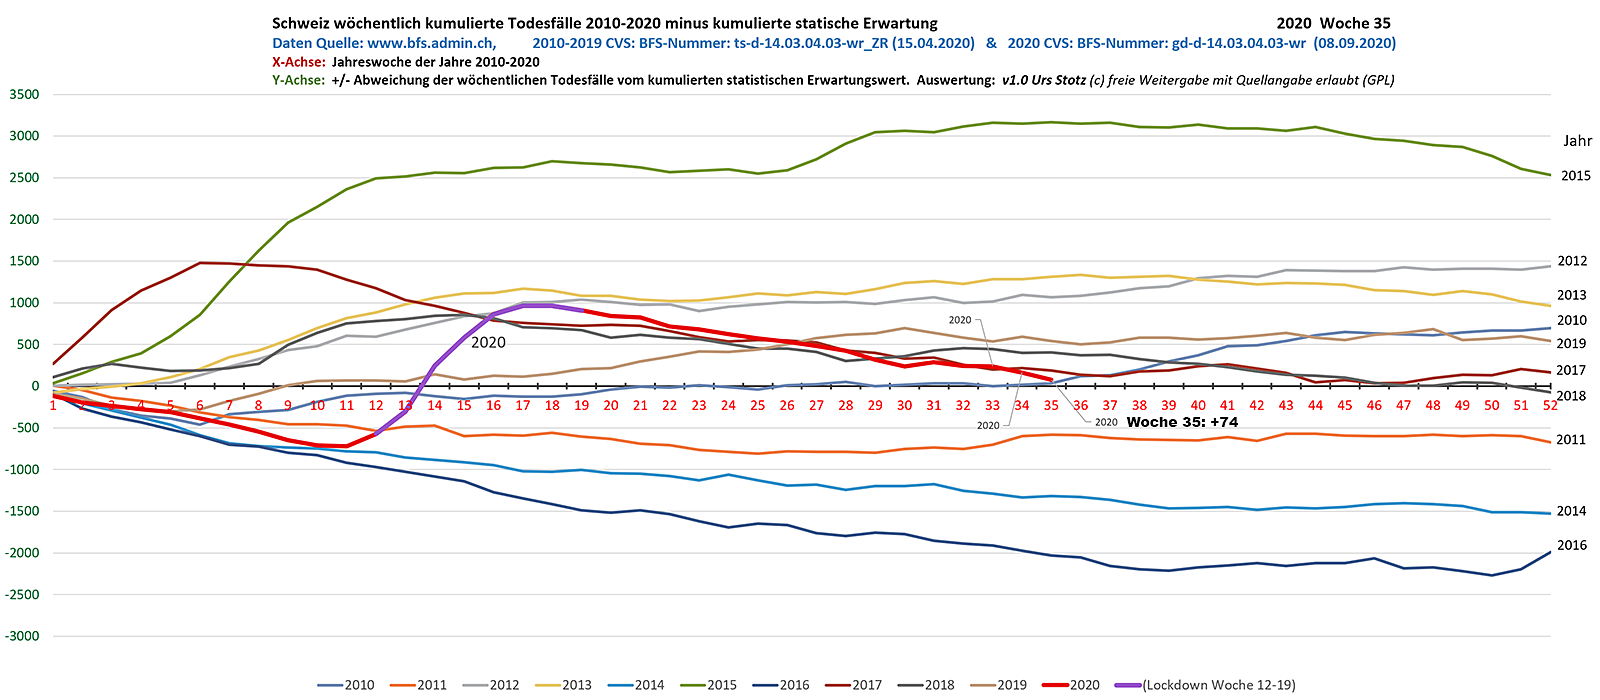
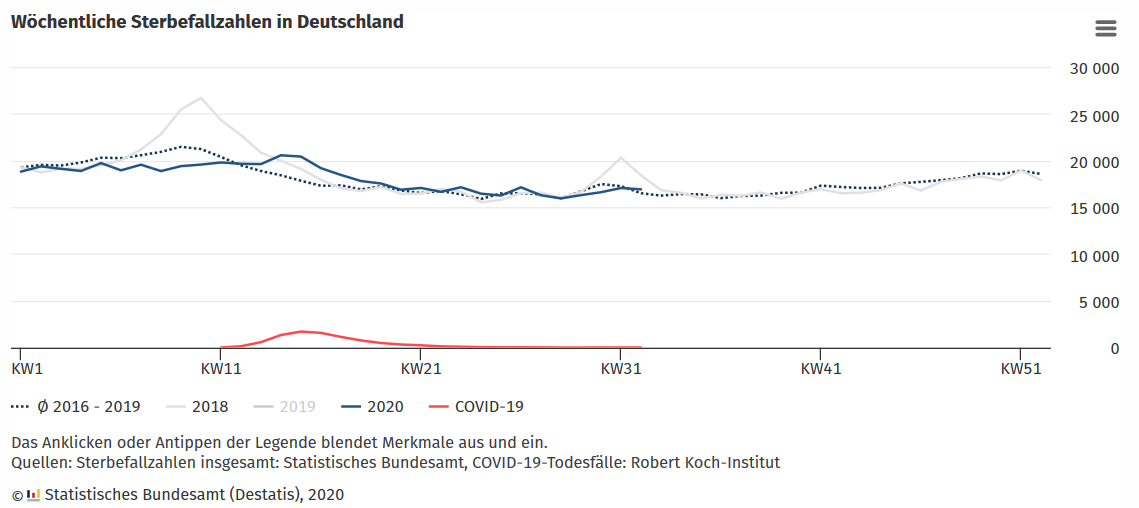
In countries like the UK (lockdown) and Sweden (no lockdown), overall mortality since the beginning of the year is in the range of a strong influenza season; in the US, mortality is in the range of the 1957 and 1968 influenza pandemics; in countries like Germany, Austria and Switzerland, overall mortality is in the range of a mild influenza season (but antibody levels are still low).
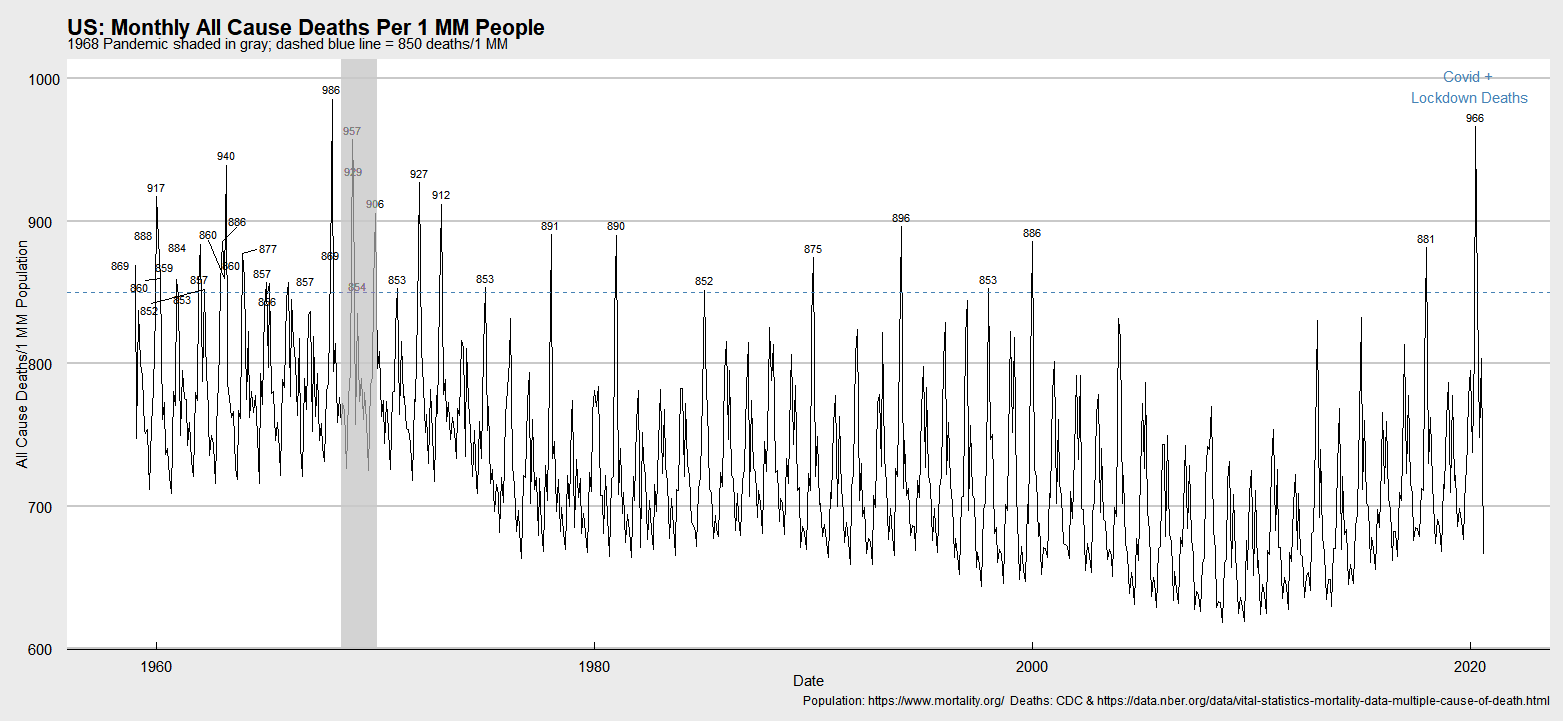


Sources: USA-1, USA-2, UK-1, UK-2, Sweden, Switzerland, Germany, Belarus
A comparison between the number of coronavirus deaths predicted by the influential model of Imperial College London (no measures or moderate measures) and the actual number of deaths in Sweden shows that the model strongly overestimated the impact of the epidemic: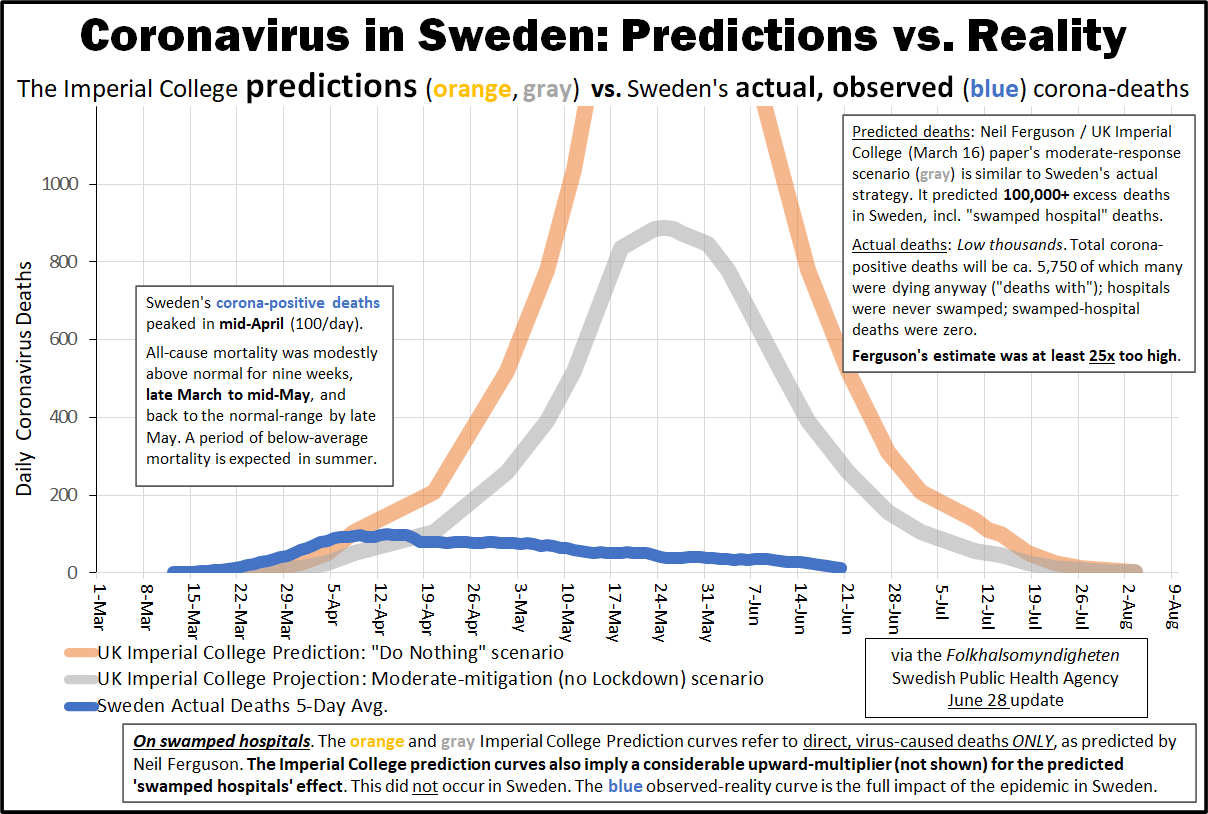 Sweden: ICL model predictions versus actual Covid-19 deaths (HTY/FOHM)
Even in states without a lockdown, the epidemic usually reached its peak within a few weeks of the outbreak. However, some reports showed cumulative deaths per day of report (left) instead of daily deaths per day of death (right), falsely implying an ever escalating situation. Cumulative deaths per day of report vs. daily deaths per day of death. (OWD/FOHM; April 24)
The United States is no exception to this dynamic. Rather, the US has seen several regional waves that were delayed due to lockdowns but then each peaked within a few weeks of the outbreak. US: Covid cases by region (Source)
From early on, and is being studied, is genetic predisposition and when groups were last in Asia by country. East Asians coevolved with similar viruses and are least vulnerable overall because the genetically vulnerable died centuries ago. Next are central Asians. Turks and Slavs who left Asia 1000-1500 years ago are more vulnerable. Then comes Germans and Huns who left Asia 1500-2000 years ago. More vulnerable still are the Celts and Romance who left Asia 2500-5000 years ago. The most vulnerable are Amerindians who left Asia 12000 years ago, and the African diaspora that was never there (excluding Africans themselves due to an extremely young demographic, slow penetration into remote areas, lack of testing and possibly ubiquitous hydroxychloroquine usage due to endemic malaria). The rates per million of cases and deaths in countries follow a straight line up, east to west, no matter what anybody did.
The media ignores this data because the data is racist.
God knows why, but the serology cult went off into left field very early in this process. No one rational has any idea why Case Fatality Rate got renamed Infection Fatality Rate, but that’s the direction the serology cult went.
Patients who test positive are a case. The test is the PCR. There is no guessing and extrapolating. It’s not rocket science.
CDC originally said two consecutive negative tests were required to declare the patient “RECOVERED”. That loosened recently. Now it is 2-3 weeks after a positive test is RECOVERED, provided there is no additional data. It could be sooner with additional data. But in general, cases that don’t die and aren’t in the hospital are RECOVERED based only on calendar now. It’s probably a legit change.
Since testing stabilized in numbers/availability, the case numbers mean more now than they did. The US is upticking cases, and death count per day is somewhat flat over the past week or so. Europe has had a far more severe case surge, including Sweden. Their case count looks about 1/2 of the max number of June and rising.
It’s about 6 months since the arrival in Europe. Immunity is fading.
>Europe has had a far more severe case surge, including Sweden. Their case count looks about 1/2 of the max number of June and rising.
France, UK, Russia, Belgium, Netherlands are at records. Germany highest since April 9 etc.
The US 7-day average deaths of 714 is now the lowest of the pandemic except post-1st-wave June 17 - July 10 which bottomed at 520 on July 5 and peaked again at 1178 on Aug 4. That is down 39.4% in the 2nd wave.
https://www.worldometers.info/coronavirus/country/us/
We don’t really know what second wave is. The last week had some counting issues out of Louisiana from the hurricane, so all we can do it look at the graphs and see a flattening or at best mild decline.
The problem overall is this. They are essentially all old people. Each year in the US 2 million 65+ ppl die. If the average for the year float at 750 deaths per day (which would require a sharp decline averaged with the Spring) that is 750 X 365 = 273750. That’s a 14% death count increase among the elderly, and without a treatment that can be year after year.
14% is enough to take a year or two off life expectancy for everyone. Society will have to decide if it wants to tolerate that.
Florida just filled in Saturday bumping the average to 727.
When you consider the age and physical condition of the victims, COVID has not taken 2 years off the life expectancy of those who died.
Disclaimer: Opinions posted on Free Republic are those of the individual posters and do not necessarily represent the opinion of Free Republic or its management. All materials posted herein are protected by copyright law and the exemption for fair use of copyrighted works.