
Posted on 03/31/2020 1:57:42 AM PDT by DoughtyOne
Please FReep Mail me regarding the ping list
for these reports. Thanks.
COVID-19 Update
As of 03/30/2020 22:56 PDT (taken at 23:59)
To the report...
This information addresses solely the United States.
Yesterday morning I explained that I had found a trend that
seemed to indicate we were heading in a better direction
with the growth numbers. It was a five day trend. And of
course, after me telling you about it and inspiring hope,
that's just what it remains, a five day trend... it ended
yesterday.
Lets go to the numbers.
            EOD    Day's  Size of
Date      Cases    Grwth     Gain
03/22    33,206    8,459
03/23    46,442   11,236
03/24    54,893    8,789
03/25    60,197   13,966    5,177
03/26    85,991   16,794    2,828
03/27   104,839   18,848    2,054
03/28   124,665   19,826      978
03/29   143,025   18,360   -1,466
03/30   164,620   21,595    3,235
There it is, a 3,235 increase in our number of declaredOne of the posters on the thread yesterday stated that
it was the weekend, and government offices are not open
then so reporting would naturally be lower. Now if that
had been the only day I was addressing, I would have agreed
that was the cause of the drop. But I was not addressing
a single day. I was addressing five.
Now, will tomorrow be another day like today leading up
to larger and larger growth day after day? I'm am still
skeptical about that. There are still some decent things
showing up in the numbers.
Yesterday there were 1,627 resolved cases in the U. S. We
are now only two or three days away from days that will
see four to five thousand thousand cases resolved each day.
About four or five days after that we'll be seeing over
ten thousand cases resolved each day. And then a few
days after that and we'll be seeing close to twenty
thousand cases resolved each day.
Resolved cases means fewer active cases. Even if we're
adding forty thousand cases per day, if there are ten
to twenty thousand cases being resolved those same days
it will effectively cut in half the inrease in active
cases.
As the growth in cases slows, the resolved cases come
rushing in.
There's another dynamic that I'd like to touch on. when
this outbreak started, each day there were a few cases
added. It took a few weeks to amount to much. On March
first there were 74 cases in the U. S. By the 15th there
were only 3774.
That's not how this thing will end. It ends with declared
cases dropping pricipitously with a massive wave of cases
being declared resolved. One day we'll have a few hundred
thousand active cases, and seven to ten days later we'll
have close to zero.
I'll touch on this again, as I address global numbers.
Lets look at U. S. Fatalities:
                   Per
Date       Fatal   Day
03/26/20   1,301
03/27/20   1,704   403
03/28/20   2,229   525
03/29/20   2,484   255
03/30/20   3,170   686
To keep them in perspective, we have 155,943 active cases
This addresses the situation outside Mainland China.
Much of the informaiton I revealed about things looking
better in the U. S., also apply to the international
scene. The velocity of growth there has also slowed
              EOD    Day's   Size of
Date        Cases    Grwth    Growth
03/24/20   341,530   41,462
03/25/20   390,378   48,848    7,386
03/26/20   451,006   60,628   11,780
03/27/20   516,124   65,118    4,490
03/28/20   583,107   66,983    1,865
03/29/20   641,588   58,481   -8,502
03/30/20   704,051   62,463    3,982
Although the cases did expand considerably on this day
Will it? Maybe. I'm hoping the growth is going to
continue to be challenged in it's bid to go higher,
than this growth range per day.
Yesterday I mentioned that it might be 24-48 hours
before the resolved percentage of declared cases
would begin to rise again. It did today.
The day started off with 25.708% of all declared cases
having been resolved. The day ended with 25.933% of all
declared cases having been resolved. That was the first
time the number had 24 hour growth since March 7th, over
23 days ago. At that time we were a whisker from 60% of
all declared cases being resolved. This time, as we near
that mark, we will continue upward. There will not be
another breakout zone that will mushroom like the global
number
s have since this disease escaped Mainland China.
Now I may have to eat those words if India goes virus
nuclear. Again, we'll have to wait and see.
203,908 declared cases have been resolved now. Yesterday
alone, 17,848 cases were resolved.
I mentioned that I would touch on the issue of resolved
cases and how they would grow. Right now we have over
60,000 new declared cases each day. Guess what happens
in two weeks. Today we had 17,848 cases resolved. In
about 8-10 days, we will have over 60,000 resolved cases
each day.
Now, if the growth in declared cases can be held in check
we'll begin to see the numbers of active cases drop
sharply. That's what sheltering in place, and keeping
our distance is geared to achieving.
Someone asked me if China still had cases. All I can
respond with, is that they declared 17 new cases today.
My Outside China section declares that 99.51% of all
active cases are now outside China. The take away on
that is that we have a large body of data from outside
China, and it really doesn't matter what is going on
inside China now, other than them cooking up something
we'll see in another ten years.
Here are the figures revealing how many peope in each
populace represent one case.
Globally      :   13,342
Mainland China:  488,717
Outside China :   13,407
The U. S. A.  :    2,119
Yes, we still have our work cut out for us.
Good morning...
All data below sourced from Johns Hopkins University: LINK
I have been downloading three to five reports per
day since 01/27. I have then worked up numbers that
should give a very good representation of numbers that
have been provided to the public via that site.
In my spreadsheet linked below, you'll find global
numbers including China. You will find a separate
section addressing just the Outside China figures.
Then there is now also a section with just the
United States stats in there. There are also a lot
of special stats broken out for you to browse. The
history of 203 nations and their numbers from day one
of their reporting.
You're welcome to it.
COVID-19 Spreadsheet using JHU data
Sorry, the XLS version is not available for dibursement at this time.a
p i n g
I just heard on the news that the US is poised to overtake China in Covid19 deaths. The corrupt media accepts and promotes whatever propaganda the Chicoms come up with.
We’re in the surge phase. Don’t think you’ll see much flattening out for a couple more weeks.
Very interesting data and I thank you very much for posting this, don’t stop. I think you posted the other day that flu cases especially deaths our way down this year?
Thank you!
Compare Washington with New York. New cases divided by the total number tested over the last ten days. It looks to me that the virus is running out new of places to go in the NW thus a flattening in Washington as opposed to New York where they’re still on the up-hill side.
I await for your inclusion of resolved cases in the same format.
We need the good news.
State of Tennessee numbers:
Positive 1834
Hospitalized 133
Deaths 7
My County (McMinn) positive 3
Deaths in my County 0
Correct that. Looking at the wrong paper State deaths are 13 and hospitalizations are 148. A nursing home was hit by it.
And if you subtract the top five or so metro epicenters, what do the numbers tell? The aggregate data is non informative to the non metro populations.
Thank you for the update. I was afraid the reported decrease in growth of new cases and deaths was due to reporting over the weekend.
“And if you subtract the top five or so metro epicenters, what do the numbers tell? The aggregate data is non-informative to the non-metro populations.”
Well, yes. Probably so. I actually ran those numbers but more as a back-of-the-envelope version. I began tracking cases and new case growth for the entire U.S. on 3/10 when we had 949 cases. I focus primarily on new cases (for reasons I will comment on later). I did not begin focusing on NY & NJ data until later in the month, though.
Beginning on 3/19 I made the assumption that slightly over 50% of our growth was occurring in those two states. I’m not sure of that date, but pretty sure about the percent (in the ballpark). When you project that through yesterday, the country would have 90,000 cases — not 163,000.
Again, this is a back-of-the-envelope guestimate.
“When you project that through yesterday, the country would have 90,000 cases — not 163,000.”
One additional comment. The 90K cases assume NY & NJ do not exist for math purposes. I won’t comment on whether they should or should not exist, though :-).
Thanks for the update; the posts.
Americans UNITE!
Medical virtue signaling...it’s just a shot away...
https://www.youtube.com/watch?v=RbmS3tQJ7Os
535+++++ v. 330 MILLION
The DC Divide and Control POWER CENTER won’t like it.
Well-stated BUMP!
In order to destroy the republic, they couldn’t even proudly affix their names to the XXXTRILLION dollar debt slavery bill.
| Country | Total cases | Total Deaths | Case Mortality Rate | Prev Day CMR |
| World | 803,126 | 39,032 | 4.9% | 4.7% |
| USA | 164,435 | 3,175 | 1.9% | 1.7% |
| Italy | 101,739 | 11,591 | 11.4% | 11.0% |
| Spain | 94,417 | 8,189 | 8.7% | 8.6% |
| China | 81,518 | 3,305 | 4.1% | 4.1% |
| Germany | 67,051 | 682 | 1.0% | 0.9% |
| Iran | 44,605 | 2,898 | 6.5% | 6.6% |
| France | 44,550 | 3,024 | 6.8% | 6.5% |
| UK | 22,141 | 1,408 | 6.4% | 6.3% |
| State | ||||
| New York | 67,325 | 1,342 | 2.0% | 1.6% |
| New Jersey | 16,636 | 198 | 1.2% | 1.2% |
| California | 7,426 | 149 | 2.0% | 2.1% |
| Michigan | 6,498 | 184 | 2.8% | 2.4% |
| Massachusetts | 5,752 | 56 | 1.0% | 1.0% |
| Florida | 5,704 | 71 | 1.2% | 1.2% |
| Washington | 5,250 | 210 | 4.0% | 4.1% |
| Illinois | 5,057 | 73 | 1.4% | 1.4% |
| Pennsylvania | 4,154 | 51 | 1.2% | NA |
| Louisiana | 4,025 | 185 | 4.6% | 4.3% |
| Source: Worldometers 3/31/2020 approx 8am CST | ||||
| PA is not available, only because it didn't make yesterday's list, and I didn't save everything. | ||||
| CMR is increasing in most cases. Many possibilities. |
Below is a chart I have been tracking since 3/10, shortly after we started the exponential growth.
I am focusing on the daily new cases in the U.S. and the growth factor from day to day, as the gas_dr first commented here on FR. Since about 3/17, that growth factor number has, for the most part, been declining, although we have had a few peaks. Over the last two days, it has been 1.02.
The doc in his post projected a 15 day top. He also used a range of 15 to 25 in assessing other countries. We may be closer to the 25 or a little more.
By the way, if we continue this growth and disregarding recoveries, we will be at 500,000 shortly after April 15th.
We seem to be moving in the right direction, but we need less new daily cases to see any meaningful improvement. If you follow gas_dr's hypothesis, that should happen soon. I believe his theory makes sense.
IC CLEARLY
click on image to enlarge
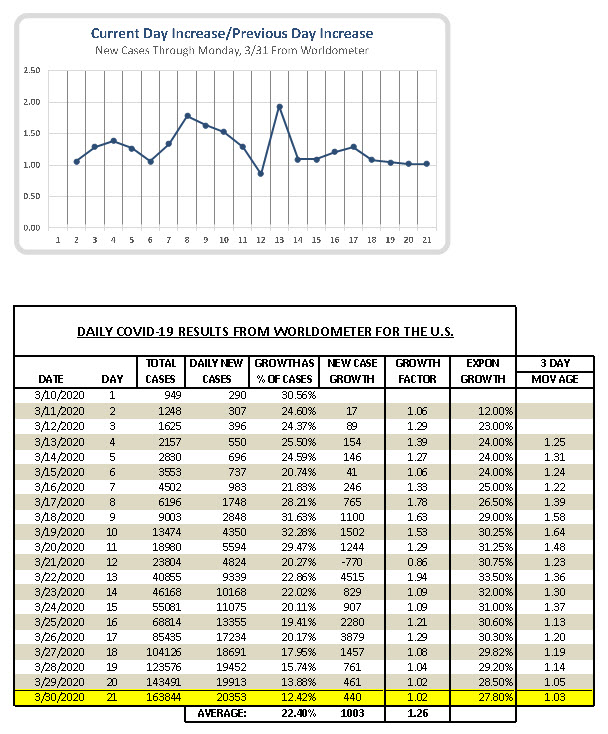
Data from Worldometer
Disclaimer: Opinions posted on Free Republic are those of the individual posters and do not necessarily represent the opinion of Free Republic or its management. All materials posted herein are protected by copyright law and the exemption for fair use of copyrighted works.