Skip to comments.
Big Data Can Lie: Simpson’s Paradox
Mind Matters ^
| April 15, 2019
| Robert J. Marks
Posted on 04/17/2019 11:40:49 AM PDT by Heartlander
Big Data Can Lie: Simpson’s Paradox
Simpson’s Paradox illustrates the importance of human interpretation of the results of data mining.
There are many ways data analytics can lead to wrong conclusions. Sometimes a dishonest data cruncher interprets data to further her agenda. But misleading data can also come from curious flukes of statistics. Simpson’s Paradox1, 2 is one of these flukes.
Here’s an example. Baseball player Babe has a better batting average3 than Mickey in both April and May. So, in terms of batting average, Babe is a better baseball player than Mickey. Right?
No.
It turns out that Mickey’s combined batting average for April and May can be higher than Babe’s. In fact, Babe can have a better batting average than Mickey every month of the baseball season and Mickey may still be a better hitter. How? That’s Simpson’s Paradox.
Here are the data for the two consecutive months:
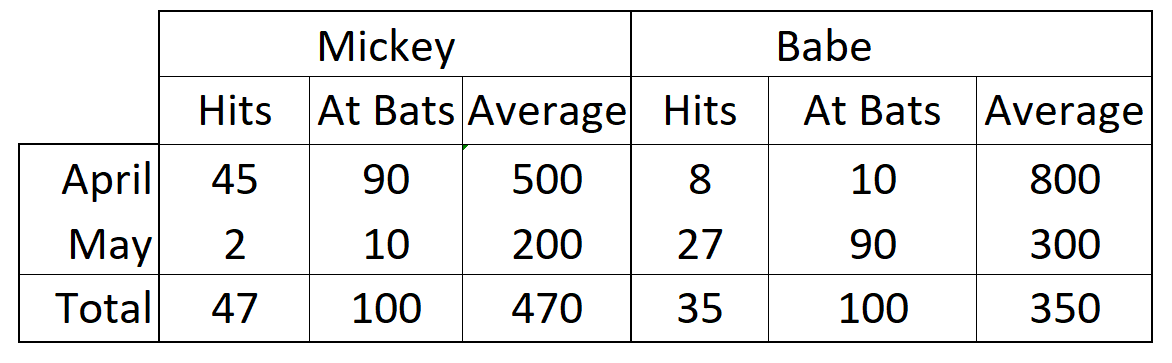 For both the months of April and May, both Mickey and Babe had 100 at bats. For April, Mickey’s stat was 45 hits out of 90 at bats and Babe’s was 8 out of 10. The batting averages (per cent times 1000) was 500 for Mickey and 800 for Babe. Babe’s batting average was much higher for April. The same is true for May. Babe’s 27 hits for 90 at bats gives her a batting average of 300 while Mickey’s average, 2 out of 10, gives him an a lower average of 200. But the aggregate data tell a different story. Mickey’s total of 47 hits gives him an average of 470 while Babe’s batting average of 350 comes from only 35 hits.
Simpson’s Paradox illustrates the importance of human interpretation of the results of data mining. Nobel Laureate Ronald Coase said, “If you torture the data long enough, it will confess.” Unsupervised Big Data can torture numbers inadvertently because aritifical intelligence is ignorant of the significance of the data.
What’s Going On?
Data viewed in the aggregate can suggest very different properties than the same data, examined in more detail, would. A more general view of Simpson’s Paradox is evident in the following animated gif 4 where experimental results of two variables are plotted.
What is the overall trend if a line is fit to this data? If all the data is used, the trend line is decreasing. If five individual data clusters are identified and lines fit, we have, for each group of points, an increasing trend. The conclusions are opposites. Without knowing which points belong to which class, there is no right answer.
Clustering remains largely an art
An underlying cause of the challenge posed by Simpson’s Paradox is clustering, where individual data points in a big data set must be grouped into distinct groups (or clusters). Clustering is a heuristic, a practical method of problem-solving that remains largely an art. In the above figure, for example, do we keep all the data in one big cluster, divide it into two groups, or five groups, or ten? If we know nothing more about the data, there is no right answer. For this particular case, we might eyeball that there are five clusters of points in the figure. But in other cases, the points are more homogeneously distributed and it will not be as clear.
Even more challenging is characterizing data that represent 25 different variables instead of only two. Directly visualizing points in a 25-dimensional space is simply not possible for a human. A seasoned practitioner with domain expertise must spend some time becoming friends with the data before figuring which data point goes where. A human is needed to make things work.
Do we really need a human to identify the clusters? Backer and Jain 5 note
…in cluster analysis a group of objects is split up into a number of more or less homogeneous subgroups on the basis of an often subjectively chosen measure of similarity (i.e., chosen subjectively based on its ability to create “interesting” clusters)
Note the repeated use of the term “subjectively,” meaning a decision based on the judgment of a human. The criterion is that the clusters be “interesting.”
There is no universally agreed upon categorical definition of a cluster in mathematics.6 Which clustering procedure or clustering procedure class is used is a human decision.
Big Data Is Ignorant of Meaning
Simpson’s Paradox illustrates the need for seasoned human experts in the loop to examine and query the results from Big Data. Could AI be written to perform this operation? Those who say yes are appealing to an algorithm-of-the-gaps. They say it can’t be done now, but maybe they’ll develop computer code to do it someday. Don’t hold your breath.
TOPICS: Education; Reference; Science; Society
KEYWORDS: datamining
Navigation: use the links below to view more comments.
first 1-20, 21 next last
To: Heartlander
I still remember my prof in Statistics 101:
Statistics NEVER give you an answer, at best, they give you another question.
2
posted on
04/17/2019 11:43:31 AM PDT
by
PeterPrinciple
(Thinking Caps are no longer being issued but there must be a warehouse full of them somewhere.)
To: Heartlander
This example is why so many ‘scientist study shows’ papers cannot be reproduced. The data is ‘interpreted’ to get the result that the researcher wants. Further, often the question is framed so that the results are predetermined prior to the data being obtained.
Raw data that may invalidate the results need not apply.
3
posted on
04/17/2019 11:45:50 AM PDT
by
rstrahan
To: PeterPrinciple
And as much as they try to tell you otherwise... all “AI/Machine Learning” is, is glorified statistical analysis... which is why a woman was run over by a car... because as much as they try to tell you otherwise, computers are dumb.
To: Heartlander
I remember Global Warmists argued that hurricanes were getting worse because of the number of people impacted by them. But they ignored the fact that one hurricane hitting a major population center will shoe more people impacted than several WORSE hurricanes in unpopulated areas.
To: Heartlander
6
posted on
04/17/2019 11:51:02 AM PDT
by
Vaquero
(Don't pick a fight with an old guy. If he is too old to fight, he'll just kill you.)
To: Heartlander
The dots seem to form a kitty, Doctor.
7
posted on
04/17/2019 11:51:02 AM PDT
by
blueunicorn6
("A crack shot and a good dancer")
To: Heartlander
Plus the internet is full of shitposters who are deliberately flooding Big Data with garbage, sarcasm, trolling, and other things not easily detected by algorithm.
8
posted on
04/17/2019 11:54:15 AM PDT
by
thoughtomator
(The Clinton Coup attempt was a worse attack on the USA than was 9/11)
To: PeterPrinciple
My engineering prof:
Figures can’t lie, but liars can figure.
9
posted on
04/17/2019 12:00:20 PM PDT
by
HombreSecreto
(The life of a repo man is always intense)
To: Heartlander
State universities LIVE on this. Only an average of 18 students per class... but 90% of your classes are lecture-center classes with 300 students!
10
posted on
04/17/2019 12:20:46 PM PDT
by
dangus
To: dangus
... that’s because “average class size” is reported from the point of view of the class, not the student. So, yes, there are loads of classes with less than 10 students... but your typical student isn’t going to be in them. Consider a university with 100 classes: 90 have 9 students, and 10 have 219 students. From the point of view of the class, 90% of the classes have less than 10 students, but from the point of view of the student. That’s the way the state universities frame it. But from the point of view of the student, more than 70% if the classes have more than 200 students.
11
posted on
04/17/2019 12:29:17 PM PDT
by
dangus
To: Heartlander
I did a research paper for my MBA on cluster analysis. I took all privately owned sports teams and clustered them. I used Yes/No criteria to minimize subjectivity and bias. Twenty one variables included bought or inherited team, championship or not, wealth came from manufacturing or service industries, etc.
I got six clusters that indicated that owners who got their wealth from manufacturing and bought the team were most successful.
A similar study for bank profitability showed little clustering based on bank deposits, office space, age or other variables.
12
posted on
04/17/2019 1:00:48 PM PDT
by
NTHockey
(Rules of engagement #1: Take no prisoners. And to the NSA trolls, FU)
To: Heartlander
Good example:
My daughter is a Registered Nurse. She works in a hospital.
While a teenager she worked at a local restaurant called Eat n’ Park. That is a Pittsburgh area chain. The company that owns it is called The Eat n’ Park Hospitality Group.
My daughter has not lived at home in a decade. Despite this I get fistfuls of junk mail trying to sell computers and things addressed to my daughter, at the “Eat n’ Park Hospital Group”, which is apparently headquartered in my modest house in suburban Pittsburgh.
Data mining and AI obviously put some pieces together in a very incorrect way.
To: Heartlander
yes, they pay me to analyze data and make decisions based on my judgement at the time ..
winner winner chicken dinner
14
posted on
04/17/2019 1:46:39 PM PDT
by
ßuddaßudd
((>> M A G A << "What the hell kind of country is this if I can only hate a man if he's white?")
To: Heartlander
Reminds me of Jim Bouton in Ball Four when he was in contract negotiations and management was listing all of the “bad” statistics from the prior year. His response was “Tell Your Statistics to Shut up!”.
Always loved that one!
15
posted on
04/17/2019 2:15:39 PM PDT
by
Pendergast
(I'm new and I don't have one!)
To: Heartlander
It always gets back to the base rate.....
To: Buckeye McFrog; Gamecock; SaveFerris; PROCON
While a teenager she worked at a local restaurant called Eat n’ Park. That is a Pittsburgh area chain. The company that owns it is called The Eat n’ Park Hospitality Group. My daughter has not lived at home in a decade. Despite this I get fistfuls of junk mail trying to sell computers and things addressed to my daughter, at the “Eat n’ Park Hospital Group”, which is apparently headquartered in my modest house in suburban Pittsburgh.Sounds like it's time to buy a slicer and a case of Kaiser rolls and put in a drive thru window. The sky's the limit!

To: HamiltonJay
at the end of the day, computers only do what you tell them to do... thus inherent biased
18
posted on
04/17/2019 11:15:57 PM PDT
by
willyd
(I for one welcome our NSA overlords)
To: willyd
Its not simply inherently biased, its inherently stupid.
ML can bring you some great insights, but it, like everything else is simply a tool. The Bell Curve exists even within these systems... and unlike a human interaction where you can tell by mannerisms, history of that person, etc.. that they are outside what the algorithm picks up, because they are on the edges of the bell curve, a human can pick up.
This is why an autonomous vehicle that physically “saw” a person crossing the street at night, long before a human could have possible saw them, decided to drive right over her, while other cars simply went around her.
To: Heartlander
Data viewed in the aggregate can suggest very different properties than the same data, examined in more detail, If you divide data into arbitrary groups one can get whatever interpretation one wishes.
20
posted on
04/18/2019 6:02:49 AM PDT
by
mjp
((pro-{God, reality, reason, egoism, individualism, natural rights, limited government, capitalism}))
Navigation: use the links below to view more comments.
first 1-20, 21 next last
Disclaimer:
Opinions posted on Free Republic are those of the individual
posters and do not necessarily represent the opinion of Free Republic or its
management. All materials posted herein are protected by copyright law and the
exemption for fair use of copyrighted works.
FreeRepublic.com is powered by software copyright 2000-2008 John Robinson