The raw data on sea levels is repeatedly adjusted "up"
Posted on 05/24/2012 12:14:29 PM PDT by Ernest_at_the_Beach
Frank Lansner’s first graph surprised me. It’s well known and often quoted that sea levels have been rising by 2-3mm a year every year for the last 20 years. But it’s not well known that the original raw satellite data doesn’t show that at all.
What astonished me was the sea levels first recorded by the Topex Poseidon satellite array showed virtually no rise at all from 1993-2001. Surely not, I thought. I asked sea-level expert Nils Axel-Morner, and he confirmed: “Yes, it is as bad as that.“ Now, given that Envisat (the European satellite) showed no rise from 2003-2011 (until it was adjusted) that means we have almost 20 years of raw satellite data showing very little rise.
We thought satellites would finally give us a definitive answer on sea levels. Instead, like the tide gauges, and every other tool available to mankind, apparently satellites systematically underestimate the rising trends. And despite the speed of light being quite quick and all, it can take years for the data to finally arrive. Sometimes 4 or 5 (or 10 years) after the measurement was made scientists “discover” that it was wrong.
Now of course, any one of these adjustments could be for very legitimate reasons and give us results closer to the truth. But the adjustments always bring data closer to the modeled trend. It’s decidedly non-random. Either there is a God who thinks teasing climate scientists is spiffy, or else there is something fishy going on, and some investigative journalists need to ask some investigative questions. Is that sea-level rise due to global warming or is it due to global adjustments?
– Jo
————————————————————————————————————-
Edited by Jo Nova
The raw data on sea levels is repeatedly adjusted "up"
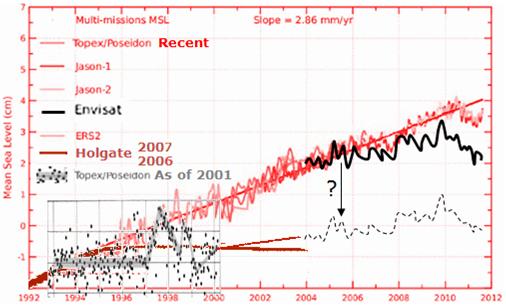
Fig 1 The data for recent years has gone through significant changes. In Morner 2004 the raw satellite data for sea level rise was shown with the original slope (the grey line with dots named “Topex/Poseidon as of 2001” above).
The data was shown in the Morner 2004 peer reviewed article. It does seem that Morner was simply presenting data on sea levels as they were known at the time. In addition, Holgate’s data from 2006-7 also seems to show a similar flat trend after 1994.
Holgate’s flat sea level graph ends in 2004 – when Envisat starts out with yet another dataset showing flat trend. The Envisat data is stitched so that 2004-6 overlaps with the satellite data. (But it could have been aligned with the original raw data of Topex/Poseidon, so that Envisat continues where Holgate 2007 ended.)

Sea Levels
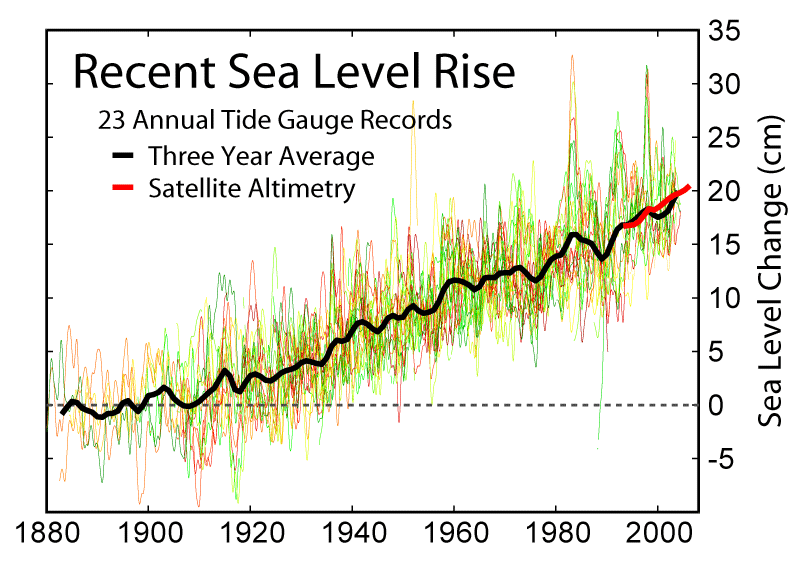
Fig 2.The original red graph is from the IPCC AR4 dataset (Church and White 2006). Other datasets for sea level rise have been added to show the trends as they were reported at the time with the year each one was released.
Something happened to the sea level data from satellites around 2004-2005 it seems, because in 2005 Morner publishes how the satellite data has been changed significantly. The trends don’t look like they did before 2004.

Sea level trends are trending up
Fig 3 The changes in sea level on a century scale still had a problem around 2006-7: Sea level data still did not support the global warming argument.
Even the results of Jevrejeva 2006 are a problem for the theory of man-made global warming. The annual sea level rise in the 1990’s were equal to the annual sea level rise of the 1940’s. That would suggest same global temperature trends for the two periods. That does not support the alarm over global warming.
Finally in 2009 Vermeer and Rahmstorf produced a dataset for sea level rise that actually suggested that annual sea level rise in the 1990’s exceeded the 1940’s rate and thus suggested warming was increasing faster now than it was in the 1940’s. This was the first time that a dataset for sea-level rise was produced that actually supported the global warming argument.
Meanwhile, sea level data from Envisat keeps coming in, and it seems that the new project staff have no idea they have to produce global warming adapted data:

The European Satellite also needed an upwards "correction" (in red)
Fig 4. As always there is some kind of adjustment making data a little more GW friendly, but still, the adjusted version of Envisat shows a tiny slope of around 6-7 cm per century… (the unadjusted showed 3 cm per century.)

Sea levels recorded by ENVISAT were dramatically corrected in early 2012.
Fig 5: The European Envisat data before (in black) and after (in red)
After the Envisat stopped transmitting, the whole series was changed dramatically. In addition, the full length of the data beginning in 2002 is now shown. It appears that Envisat data from 2002-4 shows a fall in sea level, but this dive was not shown until now when the new stronger increase in sea level dominates the picture.
Gornitz V, Lebedeff S. 1987. Global sea-level changes during the past century. In Sea-level Fluctuation and Coastal Evolution, Nummedal D, Pilkey OH, Howard JD (eds). The Society for Sedimentary Geology: Tulsa, Oklahoma; 316, (SEPM Special Publication No.41).(1987) [Data]
IPCC Assessment Report 4, Working Group I, Chapter 9. [pdf]
http://ruby.fgcu.edu/courses/twimberley/EnviroPhilo/PastRecords.pdf
Stoddart, D.R. and Reed, D.J. (1990) Sea-level rise as a global geomorphic issue, Progress in Physical Geography December 1990 14: 441-445, doi:10.1177/030913339001400401 [PDF]
Morner. N.A. Estimating future sea level changes from past records, Global and Planetary Change 40 (2004) 49–54 doi:10.1016/S0921-8181(03)00097-3 [PDF]
Holgate 2006 (poster version): [PDF]
Holgate, S.J. 2007. On the decadal rates of sea level change during the twentieth century. Geophysical Research Letters 34: 10.1029/2006GL028492 GRL: [PDF]
Morner N.A.: Memorandum by Professor Nils-Axel Mörner, Head of Paleogeophysics & Geodynamics, Stockholm University, Sweden President, (1999-2003) of the INQUA Commission on Sea Level Changes and Coastal Evolution, Leader of the Maldives Sea Level Project http://www.publications.parliament.uk/pa/ld200506/ldselect/ldeconaf/12/12we18.htm
Jevrejeva, S., Grinsted, A., Moore, J. C., and Holgate, S. (2006) Nonlinear trends and multiyear cycles in sea level records, J. Geophys. Res., 111, C09012, doi:10.1029/2005JC003229. [Source] [PDF]
Church, J.A. and White, N.J. 2006. A 20th-century acceleration in global sea-level rise. Geophysical Research Letters 33: 10.1029/2005GL024826. [eea.europa.eu]
Vermeer, M., and S. Rahmstorf, 2009. Global sea level linked to global temperature. Proceedings of the National Academy of Sciences. 106:6. PNAS (PDF)
Steven Goddard on Envisat:[real-science.com]
Watts/Goddard on Envisat: [WattsUpWithThat-April-2012]
Frank Lansner writes HideTheDecline, from Denmark.
Global Warmists and Evolutionists alike could publish whole recipe books on how to cook data.
Where is this conflicting information coming from? I have prepared myself for Nirvana now that Obama is here. No more climate problems, paying bills (he will take care of that for me) worrying about health care, home heating, or anything.
you mean these climate scientist (barf alert) may have mislead the world and faked the data. Al gore will be so disappointed.
(I love being sarcastic with liberals)
Institutions and scientists taking government money and then committing fraud can be PROSECUTED.
See my tagline.
Can that be expanded to include Representatives and Senators?
******************************************************
The short killer summary: The Skeptics Handbook. The most deadly point: The Missing Hot Spot.
“Global adjustments?” The Earth is hiking up its pants?
If we're going to get excited about something maybe we should get excited about how slow (or non-existent) sea level rise is compared to the average over the last one hundred and eighty centuries.
Claim That Sea Level Is Rising Is a Total Fraud - Nils Axel-Morner

Sea levels began to rise 18k years ago at the end of the last glacial period. They have risen about 135 meters since then which is an average of 7.5 millimeters per year. That is an average of 750 mm per century (29.5 inches) which is far more than the average over the last century.
From 1880 to 2000 sea level rose about 20 cm or just under 8 inches. Far far less than the nearly 30 inches per century average over the last 18,000 years.
I skiped through that pretty quick. Did anyone say how man is making the sea rise? Did they say how man can stop it?
If we all died tomorrow would the tide still rise?
I guess you did. The article is about how sea levels aren't rising. It's right there in the third sentence.
There was a Gilligan’s Island episode based on the same concept. The Professor thought the island was sinking because Gilligan was moving his measuring stick. At the time I thought it was written in their typical slapstick style, moronic mistakes that no real person would make. Little did I realize back then how adept liberals are at making moronic mistakes look natural.
Good stuff.
thanks.
Here is a really simple question.
If the oceans worldwide are rising every year, couldn’t you over time record this at docks, shorelines, sticks in the ground, etc., all over the world?
Seems to me if the measurement remains millimeters from satellite studies and are disputable, that isn’t ever going to be worth worrying about.
And I invested in snorkel gear to beat the rising water!
I guess that oceanfront condo I bought in Vegas was a scam. /s
I guess I'll deed it to my great great great grandson of my kid's great great great grandson.
Disclaimer: Opinions posted on Free Republic are those of the individual posters and do not necessarily represent the opinion of Free Republic or its management. All materials posted herein are protected by copyright law and the exemption for fair use of copyrighted works.