Skip to comments.
It's official. Earth just had its hottest month ever recorded
Global Post ^
| Aug 20, 2015
| Timothy McGrath
Posted on 08/23/2015 1:01:20 AM PDT by bob_denard
So there's a new climate report out from the National Oceanic and Atmospheric Administration (NOAA). Which do you want first — the good news or the bad news? LOL jk, it's all bad news!
The NOAA has confirmed that July 2015 was the warmest month ever recorded on Earth. The average temperature across the Earth's land and ocean surfaces was 61.86 degrees Fahrenheit — 1.46 degrees warmer than the 20th-century average, 0.08 degrees warmer than the previous record set in 1998, and the hottest month since humans began recording global temperatures in the 1880s.
The findings verify preliminary data released several days ago by NASA and the Japan Meteorological Administration.
Here's what our super hot July looked like.
(Excerpt) Read more at globalpost.com ...
TOPICS: Science
KEYWORDS: 201508; agw; climatechange; datatampering; globalwarming; globalwarminghoax; noaa; temperatures
Navigation: use the links below to view more comments.
first 1-20, 21-40, 41-60, 61-80, 81-95 next last
To: bob_denard
2
posted on
08/23/2015 1:10:10 AM PDT
by
WKUHilltopper
(And yet...we continue to tolerate this crap...)
To: bob_denard
Haha! Says those receiving grants from the Government! You are a bunch of clowns! When the Government give grants for opposing views, then I just might believe you but until then...
3
posted on
08/23/2015 1:10:27 AM PDT
by
Deagle
To: bob_denard
It’s settled. Shh. No talking.
Shut up.
Conversation over.
Kaput.
Done.
Over.
Don’t talk.
Quiet.
4
posted on
08/23/2015 1:14:49 AM PDT
by
Nachum
(Obamacare: It's. The. Flaw.)
To: bob_denard
5
posted on
08/23/2015 1:17:46 AM PDT
by
Hoosier-Daddy
("Washington, DC. You will never find a more wretched hive of scum and villainy. We must be cautious")
To: bob_denard
It's official. But that doesn't make it true.
The NOAA has shamelessly manipulated the US surface temperature records. This is one of the world’s most influential climate records, and they just faked it.
In recent years NOAA’s US Historical Climatology Network (USHCN) has been adjusting its temperature record by replacing real temperatures with data fabricated by computer models.
The effect of this has been to downgrade earlier temperatures and to exaggerate those from recent decades, to give the impression that the Earth has been warming up much more than is justified by the actual data.
Steven Goddard uncovered all this on his blog Real Science - look for posts headed 'Data tampering at USHCN/GISS', or just 'NOAA' I guess.
Goddard compares the currently published temperature graphs with those based only on temperatures measured at the time. These show that the US has actually been cooling since the Thirties, the hottest decade on record; whereas the latest NOAA graph, nearly half of it based on fabricated data, shows it to have been warming at a rate equivalent to more than 3 degrees centigrade per century.
The NOAA is not a scientific organisation. They faked their data.
6
posted on
08/23/2015 1:20:25 AM PDT
by
agere_contra
(Hamas has dug miles of tunnels - but no bomb-shelters.)
To: agere_contra
7
posted on
08/23/2015 1:31:46 AM PDT
by
agere_contra
(Hamas has dug miles of tunnels - but no bomb-shelters.)
To: bob_denard
Hey, I’ve got beach front property to sell here in Nevada as well.
8
posted on
08/23/2015 1:43:40 AM PDT
by
Reno89519
(American Lives Matter! US Citizen, Veteran, Conservative, Republican. I vote. Trump 2016.)
To: bob_denard
9
posted on
08/23/2015 1:49:48 AM PDT
by
ETL
(ALL (most?) of the Obama-commie connections at my FR Home page: http://www.freerepublic.com/~etl/)
To: agere_contra
From your link...
Data Tampering At USHCN/GISS
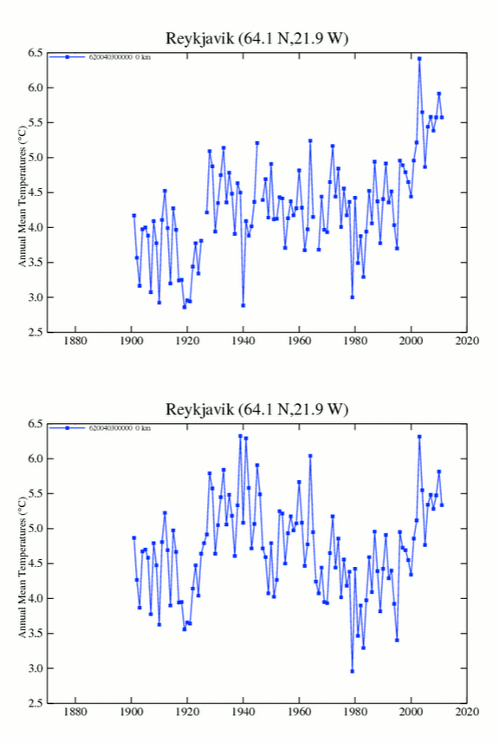
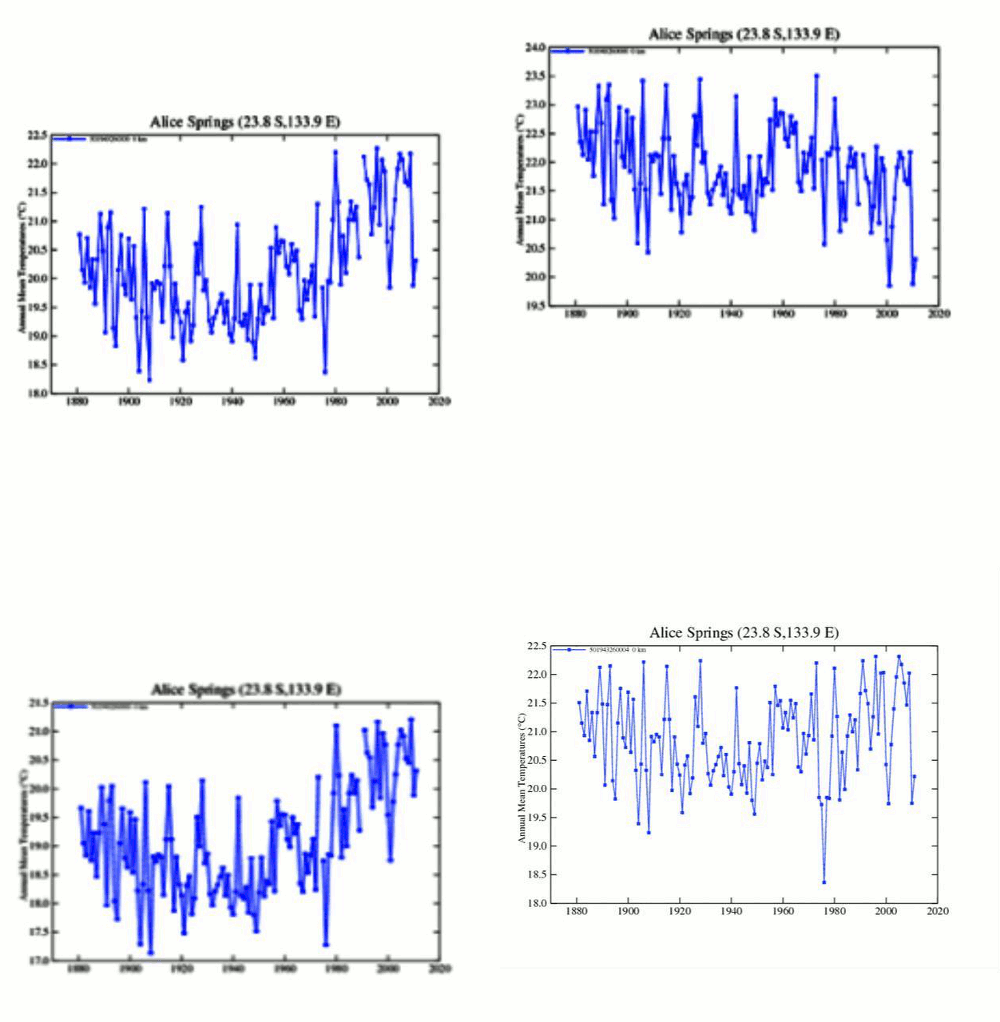
The measured USHCN daily temperature data shows a decline in US temperatures since the 1930s. But before they release it to the public, they put it thorough a series of adjustments which change it from a cooling trend to a warming trend.
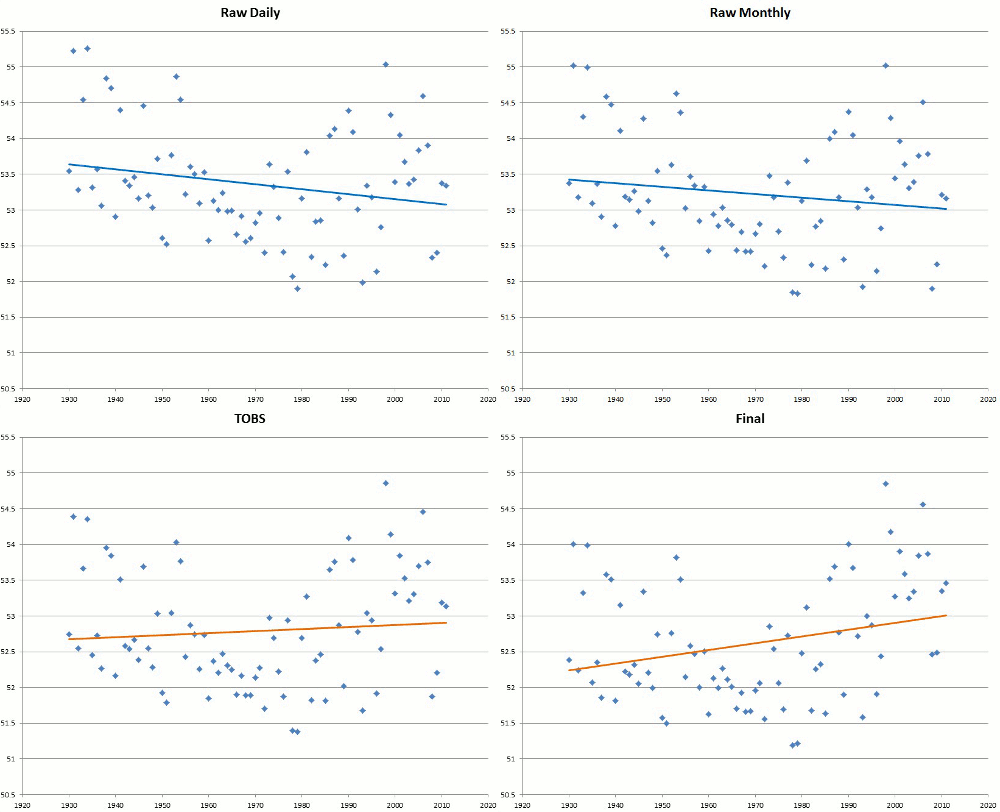
The graph below shows the difference between the published data and the measured data.

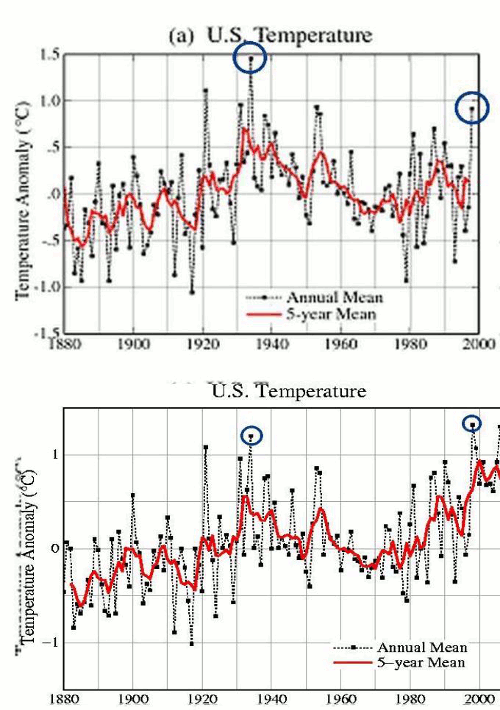
The next blink comparator shows changes in the US temperature record from GISS. It alternates between their 1999 graph and the 2012 version of the same graph. The past is cooled and the present is warmed.
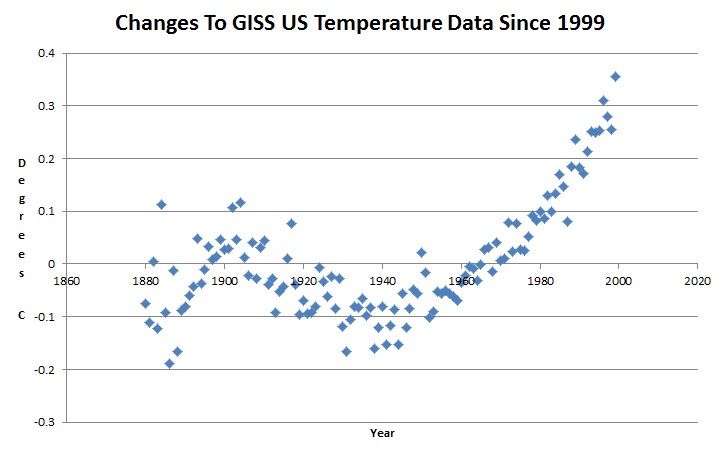
The next graph shows the difference between the 2012 version of the GISS US temperature graph, and 1999 version.
How the US hockey stick was built
As of 1999, there wasn’t any warming in the US

Hansen made these remarkable comments in 1999 :
Empirical evidence does not lend much support to the notion that climate is headed precipitately toward more extreme heat and drought. The drought of 1999 covered a smaller area than the 1988 drought, when the Mississippi almost dried up. And 1988 was a temporary inconvenience as compared with repeated droughts during the 1930s “Dust Bowl” that caused an exodus from the prairies, as chronicled in Steinbeck’s Grapes of Wrath…..
in the U.S. there has been little temperature change in the past 50 years, the time of rapidly increasing greenhouse gases — in fact, there was a slight cooling throughout much of the country
NASA GISS: Science Briefs: Whither U.S. Climate?
At that time, GISS US temperature data showed an 80+ year decline in US temperatures, with 1934, 1921 and 1931 being the three hottest years
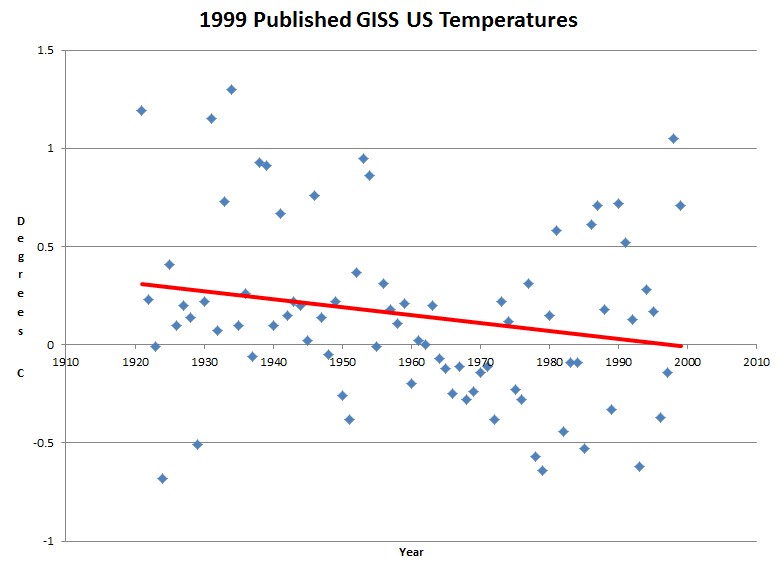
This data has been deleted from the GISS web site, but originally resided at this URL
gistemp/graphs/FigD.txt
It has been archived here :
www.john-daly.com/usatemps.006
The next graph shows the 1920-1999 changes which Hansen made to the US temperature record since 1999 – in GISS version 3.

gistemp/graphs_v3/Fig.D.txt
The GISS US temperature graph looks like this
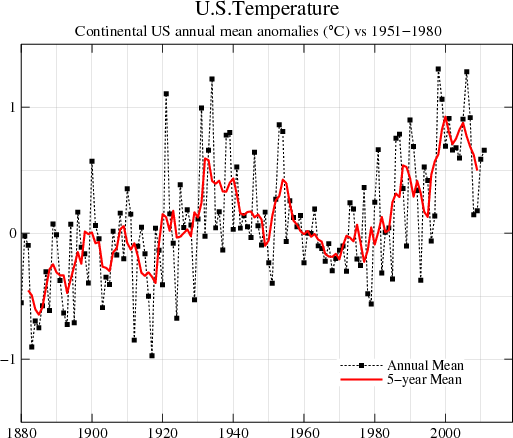
Fig.D.gif (513×438)
The next blink comparator shows the changes that were made to the US temperature data since 1999. The year 1998 was promoted from #4 to #1.

Hockey sticks are indeed man-made – by climate activists pretending to be scientific heads of government agencies.
_____________________________________
https://stevengoddard.wordpress.com/data-tampering-at-ushcngiss/
10
posted on
08/23/2015 1:54:08 AM PDT
by
ETL
(ALL (most?) of the Obama-commie connections at my FR Home page: http://www.freerepublic.com/~etl/)
To: bob_denard
Earth heading for 'mini ice age' in just 15 years, scientists say UPI ^ | Updated July 11, 2015 | Doug G. Ware Solar scientists predict that the Earth will enter a "mini ice age" around 2030 due to decreased activity by the sun, which will bring with it frigid cold winters. The last time the Earth experienced a similar situation occurred between 1645 and 1715.
(Excerpt) Read more at upi.com ...
11
posted on
08/23/2015 1:58:59 AM PDT
by
ETL
(ALL (most?) of the Obama-commie connections at my FR Home page: http://www.freerepublic.com/~etl/)
To: ETL
Thanks ETL.
I’d like to draw the thread’s attention to the graph “Changes to GISS US Temperature Data since 1999”.
This graphs shows the amendments to the real temperature record - the NOAA have added this sickle-shaped pattern on the data to suit their political masters. It’s completely fabricated.
Note that these fabricated, not true, amendments include a -0.1 degree C change to 1930’s/1940’s data and a +0.3 degree C change to most recent data. This turns the cooling trend since the 1930s into a straight increase.
12
posted on
08/23/2015 2:10:46 AM PDT
by
agere_contra
(Hamas has dug miles of tunnels - but no bomb-shelters.)
To: bob_denard
How long has NOAA been measuring temperature to hundredths of a degree Fahrenheit?
To: bob_denard
I would bet that the comet that wiped out the dinosaurs made it really hot that year. Too bad no one was around to jot it down.
To: bob_denard
Notice this “alarming” news is released just months before another major World Climate Shake-down Conference.
More socialist fakery at our expense!!
To: agere_contra
I’d like to draw the thread’s attention to the graph “Changes to GISS US Temperature Data since 1999”. This graphs shows the amendments to the real temperature record - the NOAA have added this sickle-shaped pattern on the data to suit their political masters. It’s completely fabricated.
Note that these fabricated, not true, amendments include a -0.1 degree C change to 1930’s/1940’s data and a +0.3 degree C change to most recent data. This turns the cooling trend since the 1930s into a straight increase.
______________________________________________________
The next graph shows the difference between the 2012 version of the GISS US temperature graph, and 1999 version.


16
posted on
08/23/2015 2:25:39 AM PDT
by
ETL
(ALL (most?) of the Obama-commie connections at my FR Home page: http://www.freerepublic.com/~etl/)
To: ETL
Thanks again ETL, much appreciated.
17
posted on
08/23/2015 2:27:28 AM PDT
by
agere_contra
(Hamas has dug miles of tunnels - but no bomb-shelters.)
To: bob_denard
Just because they DemocRAT CONTROLLED National Oceanic and Atmospheric Administration (NOAA) published that LIE, does NOT make it TRUE.
18
posted on
08/23/2015 2:33:48 AM PDT
by
Yosemitest
(It's Simple ! Fight, ... or Die !)
To: agere_contra
You’re welcome. Glad to do it. Understanding it, at 5:45 AM here in New York, is another thing! :)
19
posted on
08/23/2015 2:41:28 AM PDT
by
ETL
(ALL (most?) of the Obama-commie connections at my FR Home page: http://www.freerepublic.com/~etl/)
To: bob_denard
I’d love to see one of these reports were they didn’t have to keep “adjusting” the data.
Better yet, I’d love to see an explanation of why some data has to be adjusted, how is that decided and then what judgments go into determining how much to adjust and in what direction.
Too much fiddling with the numbers here.
Oh, and by the way, were measurements from previous years adjusted down in order to make this conclusion fit the assumption?
20
posted on
08/23/2015 2:48:49 AM PDT
by
plangent
Navigation: use the links below to view more comments.
first 1-20, 21-40, 41-60, 61-80, 81-95 next last
Disclaimer:
Opinions posted on Free Republic are those of the individual
posters and do not necessarily represent the opinion of Free Republic or its
management. All materials posted herein are protected by copyright law and the
exemption for fair use of copyrighted works.
FreeRepublic.com is powered by software copyright 2000-2008 John Robinson


