Free Republic
Browse · Search
Bloggers & Personal
Topics · Post Article

To: agere_contra
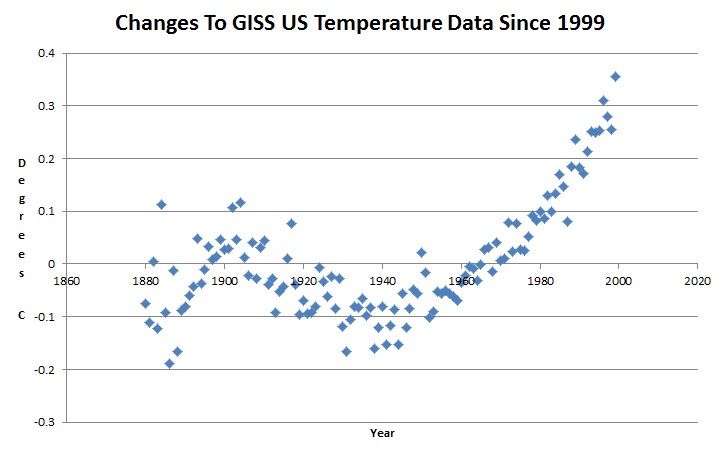
I’d like to draw the thread’s attention to the graph “Changes to GISS US Temperature Data since 1999”.

This graphs shows the amendments to the real temperature record - the NOAA have added this sickle-shaped pattern on the data to suit their political masters. It’s completely fabricated.

Note that these fabricated, not true, amendments include a -0.1 degree C change to 1930’s/1940’s data and a +0.3 degree C change to most recent data. This turns the cooling trend since the 1930s into a straight increase.

______________________________________________________

The next graph shows the difference between the 2012 version of the GISS US temperature graph, and 1999 version.

16 posted on 08/23/2015 2:25:39 AM PDT by ETL (ALL (most?) of the Obama-commie connections at my FR Home page: http://www.freerepublic.com/~etl/)
[ Post Reply | Private Reply | To 12 | View Replies ]


To: ETL

Thanks again ETL, much appreciated.


17 posted on 08/23/2015 2:27:28 AM PDT by agere_contra (Hamas has dug miles of tunnels - but no bomb-shelters.)
[ Post Reply | Private Reply | To 16 | View Replies ]

Free Republic
Browse · Search
Bloggers & Personal
Topics · Post Article


FreeRepublic, LLC, PO BOX 9771, FRESNO, CA 93794
FreeRepublic.com is powered by software copyright 2000-2008 John Robinson