
We are about 2.6 million below the pre-recession peak and up 6.2 million from the trough during the last recession.
Posted on 05/09/2013 6:46:51 AM PDT by SeekAndFind
First-time jobless claims continued their descent last week, falling to their lowest level in more than five years and providing another sign that the labor market is healing.
The number dropped by 4,000 last week to a seasonally adjusted 323,000, the best showing since November 2007, a signal that employers are laying off fewer workers, the Labor Department reported on Thursday.
The four-week moving average, a figure that provides a better trajectory of where the labor market is headed, dropped 6,250 to 336,750.
This week's figure reflects a healthier labor market. Economists say the market is in better shape when applications fall below 375,000.
Nearly a week ago, the government reported that employers added 165,000 jobs in April, a figure that exceeded expectations but also came with a warning that across-the-board spending cuts could start slicing away at the progress during the summer.
Early estimates from economists that job growth could drop to around 125,000 a month during the summer while the economy absorbs the effects of the $80 billion sequester.
The White House and congressional leaders continue their calls to replace the sequester but there remains a gulf between how they want to cover the costs.
Democrats want a mix of revenue raisers and spending cuts while Republicans remain inclined to push for a different set of spending cuts.
(Excerpt) Read more at thehill.com ...
The demoralization of the lower and middle classes is about complete. Next task is to bury them so they don't dare seek work again.
Based on the employment numbers, the recovery has been very slow; but to be honest, if I were to look at only the jobless claims numbers, I would say that there is in fact a recovery. HOWEVER, there are other key data points that tell a big picture:
1. The actual number of employed is rather low. New jobs are not being created as rapidly as they should be.
2. I would be much more happy with the improving numbers if we were not doing it with a fed government spending 40 percent more than it takes in, year after year.
3. The future of unfunded liabilities is going to cause major problems.
4. Much of the new employment is around the energy industry. That has been, and will continue to be, a blessing for the US; however, it can only go so far. I think that we are on the way to another financial crisis based on uncontrolled federal spending, but the energy industry provided enough new value to the US balance sheet so that the inevitable crisis can be put off for another 5 to 10 years (put off via financing future value and wasting those funds today).
In other words, think of it this way. The increased value of the energy industry effectively allowed the federal government to enter into a long-term refinancing of the United States (akin to refinancing a home) at 150 percent loan to value, with a low fixed interest rate that stays low for 5 years, but is floating and able to increase after 5 years.
Could be. The trough for each of the last three cycles has been 4WMA claims of less than 300K (average trough of around 285,000). We are at 336,750 right now. The average sequential weekly decline over the last year has been about 800 so to get to below 300,000 we have about 46 weeks and about 65 weeks to get to the trough of the last 3 cycles.
Those are two separate charts/measures - continuing claims and initial claims. Initial claims have very much recovered. Continuing claims (which you posted) are below the last 4 cycle peaks but still above the last cycle trough as UE is 7.5%
Curious. Insightful. Do these prognosticating experts have anything to say about the 4.5 to 8.5 Million fewer jobs (different sources) since the Messiah took office?
These OVER 300,000 claims numbers are WEEKLY! Obama and his media's lies and mistruths about 150K to 190K jobs added are MONTHLY!
It is painfully easy to understand why MILLIONS of fewer jobs are to be had now. Lies, lies and more lies.
We are about 2.6 million below the pre-recession peak and up 6.2 million from the trough during the last recession.
True, and if only we'd been up 8.3 million we be barely keeping up with population growth.

We haven't so we aren't.
“Smallest number in five years”. What a joke. Wake me when it’s the smallest number in 10 years.
When they pass amensty the nunbers will get lower.
/s

You're right, I posted continuing claims and the quote mentioned initial claims, but personally I don't see that much of an improvement. I mean, we're still worse off than we were during the financial crisis. It's also interesting to note that last week claims numbers (both initial and continuing) were revised downward.

I don’t have all the numbers in front of me now but the 4WMA for initial claims are well below the average for the last 50 years. Most economists use “below 400,000” as positive for job growth and we are significantly below that threshold. We are significantly below the peak of close to 650,000 and also below the peaks (highest initial claims) of the last five cycles.
There is a disconnect with job growth though. Job growth continues to be fairly weak (average about 157,000 NFP improvement per month the last two years.) ill try and run those charts tomorrow.
The other issue is that job growth is completely in line with 1-2% GDP growth which is the environment we are in. Very weak recovery by any standard. There is a recovery though. That’s undeniable.
For some reason or other the fed doesn't have claims stats under 'catagories' and I got to search 'claims'. No matter, we're on the same page (tx for working with me) and the latest 323K is in fact below the 363K avg. of all lvls on line.
It's definitely a sign of recovery. Arguably it may be more of a function of the shrinking workforce--
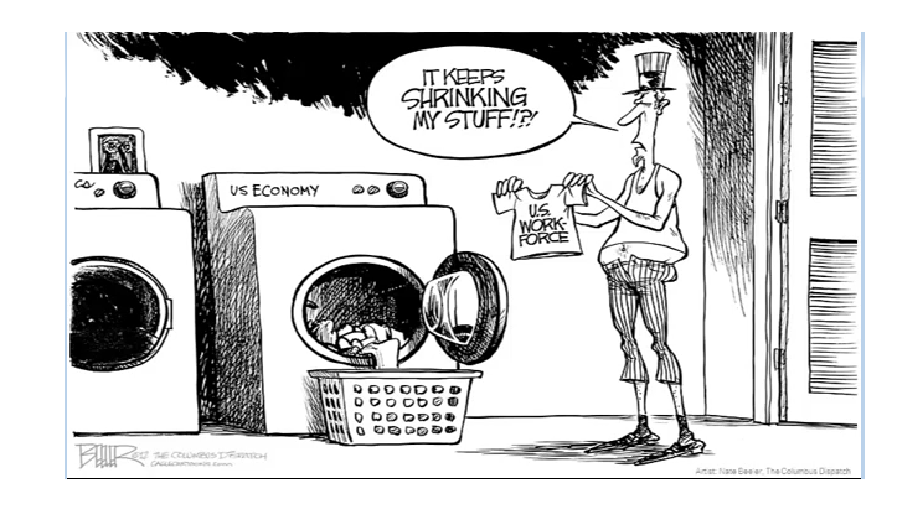
-- than shrinking unemployment, but even if it's not proof that people are going to work we still have less of a drain on unemployment comp. spending.
The claims data is under the Population, Employment, & Labor Markets section.
http://research.stlouisfed.org/fred2/categories/10
FRED’s search works really well. One of the best I’ve seen.
I’m not sure how shrinking workforce would affect initial claims. Continuing claims for sure as people get discouraged and drop out. Initial would be for people who just lost a job.
There is no doubt that the LFPR is a huge issue. The biggest question is what is driving it. Some of it is likely structural demographics although over 55 LFPR continues to rise. Women dropping out is a driver as male LFPR has been declining since the 40’s. A lot of it situational given the very slow growth in the economy.
The only cure for all of this is a pro-growth environment. I found it funny that SecTreas Lew has made several comments about pro-growth and made one today to Europe. This is the most anti-growth administration in history. Their regulations are crushing business. the gridlocked Congress is casting a fiscal shadow over growth. Now they want to raise taxes. Just sheer stupidity.
Weird. I went there and still didn't see it. Then I cntl-F'd 'claims' and it jumped right out at me.
not sure how shrinking workforce would affect initial claims
Work force > employment > initial claims.
the most anti-growth administration in history
My take is that many of them honestly believe that they favor the wellbeing of those working in the labor markets while maintaining all the necessary 'fairness' to stick it to the rest of us in the capital markets. Considering that all economic activity needs both labor and capital it becomes a de facto anti-growth program. I see it as sheer bigotry.
Is the real US unemployment rate 11.3% or 7.5%? A new Goldman Sachs study offers an answer
James Pethokoukis | May 10, 2013, 9:46 am 051013jobless

The 7.5% US unemployment rate, at its lowest level since 2008, seems to be telling a story of slow-but-steady recovery after the Great Recession and Financial Crisis. Unfortunately the bulk of evidence suggests the “real” jobless rate is far higher. As the U-3 rate has fallen, so has the labor force participation rate, or LFPR. If the LFPR were at the same level as when the downturn began, the unemployment rate would be a stunning 11.3%.
Two critical questions: First, how much of the 2.7 percentage point drop in labor force participation since 2007 reflects structural forces rather than weak demand discouraging workers? Second, is the key structural element mostly the aging of the US population or is it the shift of the workforce into Social Security disability?
A new study by Goldman Sachs, partly based on recent Federal Reserve research, offers some reasonable answers. The real jobless rate is probably more like 9%, still dreadful. And here’s why:
1. Blame the baby boomers, at least somewhat. Of that 2.7 percentage point drop, 1.2 percentage reflects demographics — a number GS arrives by plotting the overall LFPR against a rate that assumes an over-16 workforce not aging. So most of the drop in the LFPR is not due to the boomers.
2. The US isn’t Europe. Economists blame persistently high EU unemployment in the 1980s on the relatively easy availability of long-term jobless benefits. But Goldman doesn’t think the same thing is happening here, or at least nowhere to the extent as in Europe. Since 2007 the number of SSDI disabled worker recipients has risen by nearly 2 million, or 0.7% of the over-16 population.
Yet the rise in SSDI beneficiaries has only modestly outstripped the Social Security Administration’s pre-recession forecasts. Goldman: “Most of the growth in SSDI beneficiaries seems to be due to a larger and older population. … So while we would not rule out a certain amount of hysteresis, we expect it to fall far short of the European experience.”
3. The problem is mostly slow growth. So of that big drop in the LFPR, GS concludes, the remaining 1.5 percentage points—the equivalent of 3.5 million jobs—is mostly related to weak labor demand. (That’s where I get the 9% number.) As shown in a recent Fed study, labor demand shocks can have protracted effects on participation. There are lengthy lags. More typically, a big demand shock causes a sharp rise in the unemployment rate, which then reverses over the next three years. The LFPR falls more gradually and only begins to recover three years after the shock.
But not this time. GS: “ The current labor market recovery has been much slower, as the unemployment rate has reversed less than half the trough-to-peak increase more than five years after the shock. The reasons are well known—a private debt overhang, excess supply in the housing market, fiscal headwinds, and spillovers from the financial instability in Europe.” So adjusting for the weak recovery in the labor demand explains most of the LFPR decline.
Going forward, GS expects the participation rate to remain flat. Demographic changes will offset recovering labor demand. (The bank doesn’t mention it, but I would also be concerned about the impact of the PPACA on the quantity and quality of job growth.) Given the GS forecast for GDP growth, we’re looking at a 6% unemployment rate by early 2016. But that improvement will understate the true weakness of the labor market, arguing for more aggressive policy action, particularly for the long-term unemployed.
Disclaimer: Opinions posted on Free Republic are those of the individual posters and do not necessarily represent the opinion of Free Republic or its management. All materials posted herein are protected by copyright law and the exemption for fair use of copyrighted works.