Posted on 11/21/2009 6:41:34 PM PST by dila813
File called trend_profiles_dogs_dinner.png in the hacked files shows a chart that looks identical in format but with a completely different result than the one on display that is showing heating in the Tropical tropospheric trend.
The one in the hacked files shows Global Cooling Trends and not a warming trend.
In fact, the chart in the hacked files can't be found and based on the date of the file you have to wonder if the one at Real Climate is a complete fabrication or the one in the hacked files is.
The date on the file is 1/10/2008 and the one published is 10/12/2008.
I am reading the article you are referring to, I think this is what both of these charts are about.
But the data between the two charts are different.
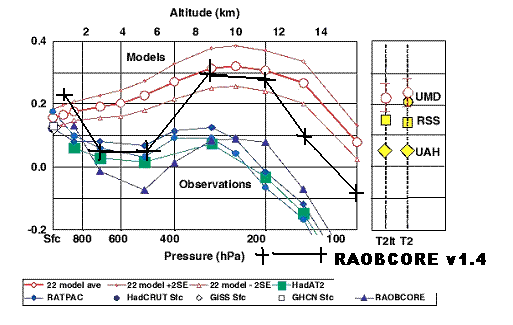
dila13 is right, the models are not the story here, it is how the real world RAOB (weather balloon) observations were adjusted to ...There is no 'there' there.
Model runs are useless. Less than useless; they have trouble ALL the way around.
Time spent in comparing them in an attempt to prove 'fraud' from this 'document dump' is going to be futile.
DON'T move the goals posts now - THIS was the original bent on this thread.
(WHY do I feel like I'm being trapped on an RC thread?)
Also any fraud that might be shown here (the pic in the zip not matching the pic at RC) has already been excused at RC (they used the "newer" RAOB reanalysis). It has also been explained over a year ago at CA (the newer RAOB reanalysis was repudiated).
I agree with your general point about the models. Also your broader point is good which is that if you argue with ...And -
I can't introduce/or go to - my main reference (a study of model outputs -the model runs - with temperatures et al) because - as that resource is blocked by heavy traffic at the moment!
I have some specific points to make, but, I need to access that particular up-to-date and relevant to the arg resource ... climatology is not my main field of study, and I certainly don't expect to argue models and going in cold w/o access to ref materials (and CA is that source, but it is tied up ATTM)!
ok, thanks for the hint here.
So the only thing different between the two charts is there is a different temperature scale on the bottom.
What the heck is K/Temperature?
The scale seems to be off by 50% between the two.
Thanks
I am not dissing you on that, for all I know you are an expert on this subject matter.
I might even take you up on the offer.
But what I am trying to tell you is that this isn’t about GCM.
It is as palmer has sited correctly, a chart in order to attack a paper that was done saying the models don’t agree with the actual observed temperature.
As a background to this look here http://74.125.155.132/search?q=cache:ZxFZTq_51hMJ:www.climateaudit.org/%3Fp%3D3082+Leopold+in+the+Sky+with+Diamonds&cd=1&hl=en&ct=clnk&gl=us
Also, look at the actual emails associated with this and this article on Real Climate.
This was specifically prepared to rebut a paper.
This isn’t the result of a GCM, a single model run or anything like that.
use the google cache
use the google cacheIF I had a classs to teach
If this was part of a deliverable package (IOW deliveable towards contract 4 payment)
If it were a LOT earlier in the evening
If I had infinite resources and time available
If ...
If it the net Kelvin change, it doesn’t make a difference, it is the same scale.
The difference between .5c and 0 is the same difference of .5c and 0 expressed in Kelvin.
I am not familiar with this temperature measure. Still can’t understand why the scale on the bottom of the charts are different.
[[I agree with your general point about the models. Also your broader point is good which is that if you argue with RC types using some particular models (like the ones displayed in this thread) you have already ceded part of the argument to them.
Also any fraud that might be shown here (the pic in the zip not matching the pic at RC) has already been excused at RC (they used the “newer” RAOB reanalysis). It has also been explained over a year ago at CA (the newer RAOB reanalysis was repudiated). ]]
Translated into english, does this mean they’ve already wriggled their way out of anythign incriminating? Or is there more incriminating evidence to come? Inquiringm inds need to know
That's worse than the Shroud of Turin radiocarbon "dating" fiasco! /hijack>
Cheers!
So is the file named dogs_dinner because this data was to supposed to be eaten by the dog, along with all sorts of other “missing” original data?
The chart has no context, but note the negative Y-axis, indicating a tropical trend that is getting colder - whatever that means.
I suggest we take the raw data, lightly sauté it, and construct another hockey stick.
This one, where temperatures have already risen catastrophically.
Of course, the solution would be for the Third World to return all of their jobs and money back to the U.S.; full drilling in ANWR; and "we have to act NOW or mankind is DOOMED"TM Under the auspices of a reputable academic, submit it to the Annals of Improbable Research (formerly Journal of Irreproducible Results), and nominate it for an Ignobel Prize.
Cheers!
Thanks for the ping.
Now explain the graphs. ;-)
It’s very complicated politically. See my last post and Steve McIntyre’s post including the comments. Essentially the RAOBs were adjusted to match the models (with plausible deniability) by Haimberger. Those adjusted versions were used in the Santer paper and trumpeted on the RC website (figure appears above). Then Haimberger’s reanalysis was repudiated. But too late! The warmers had moved on and the bogus chart with 1.3 and 1.4 is still there today.
That makes a great deal of sense.
Actually, my refrigerator seems to be undergoing global cooling. I keep turning down the temp. setting (should give less cooling), and it keeps freezing my veggies.
Disclaimer: Opinions posted on Free Republic are those of the individual posters and do not necessarily represent the opinion of Free Republic or its management. All materials posted herein are protected by copyright law and the exemption for fair use of copyrighted works.
