
Posted on 09/30/2020 9:04:24 PM PDT by DoughtyOne
PING LIST - Please contact me as needed...
COVID-19 Update # 196
As of 09/29/2020 23:15 PDST United States CDC - Provisional Numbers
As of 00/00/2020 23:45 PDST Johns Hopkins University - Capture Nations Informaton
As of 00/00/2020 23:45 PDST Johns Hopkins University - Capture Counties Information
As of 00/00/2020 23:46 PDST Johns Hopkins University - Process JHU Data
As of 00/00/2020 23:59 PDST WorldofMeters - Document Core Numbers
As of 00/00/2020 23:59 PDST WorldofMeters - Capture Nations Information
As of 00/00/2020 23:59 PDST WorldofMeters - Capture States Information
As of 00/00/2020 00:00 PDST WorldofMeters - Data Processing begins...
As of 00/00/2020 ??:?? PDST Publish COVID-19 Update - 00/00/00
Thank you for stopping by to check out the COVID-19 Update.
Here you can find...
Section: 01 Commentary, Special Reports, COVID-19 Update Info, & System Notes
Section: 02 the United States Situation
Section: 03 the Global Community Situation Outside China
Section: 04 the Global Community Situation Including China with reservations
Section: 05 the Mortality Report
Section: 06 Miscellaneous Reports of Interest
Section: 07 the United States, Counties (alphabetical / case no descending)
Section: 08 the United States, States Ranking, Provisional Numbers, & Territories
Section: 09 the United States, Ranked with Other Nations
Section: 10 the End of this COVID-19 Update
Section: 11 Data Sources and a Link to My Own Spreadsheet
Section: 12 Linked Spreadsheet: Counties, States, Provisional, Territories, & Nations
Section: 13 Links to Other Resources
Section: 01
Commentary, Special Reports, and COVID-19 Update Information3
Interesting Tid-bits (hopefully)
Fatalities and New Cases in the United States
Fatalities rose by 634 cases from the previous day, to come in at 989
yesterday. That was a 1.75% increase from the same day the week before.
New Cases rose by 4,806 from the day before, to come in at 45,096
yesterday. That was an 13.40% decrease from the same day the week before.
Fatalaties and New Cases on the Global Scene
Fatalities rose by 2,269 cases from the previous day, to come in at 6,275
yesterday. That was a 1.41% increase from the same day last week.
New Cases rose by 36,848 cases from the day before, to come in at 292,955
yesterday. This was a 1.75% decrease from the same day the week before.
Global Declared Cases Recovery MIlestone
Global Recoveries topped 25 million cases yesterday.

Section: 02
The Following Addresses the Numbers Here in
the United States of America
Here we go...

New Case Declarations rose a moderate amount yesterday.
Please take note of the Resolved Percentage level on the right.
It's also informitive to look up the data columns to see how the
situation has changed recently. We're now seeing a percentage over
there that is rather significant.
Concept of adding in Active Cases and Serious Critical here, courtesy of amorphous
Here are more of our numbers...

Active cases rose by a moderate amount yesterday.
Take note of the Serious/Critical case situation on the right there.
They've been going up and down recently.
Our Slice of the COVID-19 Pie
The growth of our slice of the pie has been increasing recently.
Here are the numbers I've been tracking, Globally Declared and Active Cases.

Yesterday we looked better in both these categories.
Active Cases in the United States / Chart
Unlike some of the other charts here, we should see a good rise and
fall at some point withone.
Note that this presents the single, seven, and fourteen day averaging versions.

Remember, these are not new Declared Cases. These are remaing Active Cases.
Active Cases fell yesterday. I'm not sure if anyone else sees this the way
I do, which translates to the possibility I am wrong on this, but I see the
flattening during the first two weeks of June, to have been the end of the
first wave. It looks like the end of the second wave right now.
The question is, where do we go from here? Are we positioning for a third
wave or are we going to start moving down in earnest? We'll soon find out.
Fauci has let it be know, he still thinks were on the first wave. He may be
right. I'm not sure what the scientific requirements are to declare a wave
over. If it settles down, that seems like an end to me, and the chart looks
for all the world like a second wave to me.
Testing and New Case Figures
Requested by stocksthatgoup
Some folks have shown an interest in seeing the COVID-19 Test figures compared
to the New Cases being declared. The following Data addresses that. The size
of it just doesn't seem reasoned to me.
Why/how could the posive portion of the popoulace vary ass much as 2.0% from day
to day? I could a lot easier see a 2.0% trend over three or four days. One day?
Nah.

Testing fell off about 25.00% yesterday.
This is the first day in two weeks where the 14-day positive percentage of
testing didn't have to deal with that 9.988% postive single day rate on 09/25.
I thought it would immediately show a drop, and it did here.

Things are back to normal here. We are going lower.
I believe we will see a low figure for teh 14 day tomorrow.
The U. S. Stats / w 10 Day Averaging / Fr: 03/17
Requested by: Texas Eagle
This data and chart presents things in a little different way. In the
chart it is easy to see the relationship of these numbers. I may be wrong
not to do so, but I don't plan to put much weight in those figures for a
few days until they normalize.
The Chart will use the data all the way back to 03/17, but the data displayed
here will only go back one month.

Here is the chart to match.


I like the New Case Declarations line right now. They are ever so slightly
moving in the direction of flattening.
The active case line has flattened out.
I have been saying I wasn't too happy with the Recoveries and Resolved Cases
lines there. At the present time they don't seem moving toward flattening any
longer. They may show some strengthling almost imperceptibly.
Compare to the rise of Recovered and Resolved cases on the Global Scene to see
a different more healthy trajectory. These look lethargic by comparison, but a
a little less so.
You can right click view to see the Global Chart enlarged.
United States Movers and Shakers...
I will present the U S States with the most New Cases and New
Fatilities rankings.
Here we go...

Texas and California took the top spots yesterday.
Section: 03
The Following Addresses the Global Numbers
without Mainland thereChina
Here is the first set of Data for the Global Outside China
Territories

New Case Declartations rose by 36,837 cases yesterday.
The Resolved percent came in at 77.112% yesterday.
Fatalities, Recoveries, Resolved, Active Cases, and
Serious/Critical Cases - Globally, Excluding M/L China
Concept of adding in Active Cases and
Serious/Critical here, courtesy of amorphous
Here we go...

Active Cases rose moderately yesterday. Serious/Critical
cases rose moderately also.
How is the Global Community Outside China Doing,
Without U. S. numbers?
Let's see...

This metric rose back up yesterday. we're heading in to the higher reporting
days now.

It was a Tuesday, and the numbers rose as we transitioned deeper into the work
week.


The blue line has offered us a glimmer of hope on the right there.
The Active Cases outside China Globally / Chart
As in the United States' version of this, we should see a good rise and fall at
some point these two.
Note that these present the one day and then 7 and 14 day averaging versions.


<
The two charts above had looked like they were revealing flattening, but as
the days went by, they began moving upward again.
Special Section on France, Germany, Italy, Spain, and the U. K.
Case growth.
Jim Noble mentioned he'd like to see the US numbers added here. I added them
in on 06/21/2020. I did not add them to the chart because it would have
dwarfed the European nations chart lines. (they would have been reduced to
about 15% of their normal size)
Let's Look at Some Numbers in Five Day Increments:


Spain - OUCH! (Will you look at Spain! Wow!)
France - Ooo
To be honest, it looks like all these nations are showing an inclination to
move up.
I checked the parameters for Spain, and they were correct. That growth is
amazing.
Frace is suffering the same fate.
Sweden and It's Neighbors, Who Has the Best Tactic Against COVID-19?
Sweden is doing its own thing with regard to isolating. I think most people
are aware of it by now.
Here are some numbers to help us look at this issue.


Sweden has flattened out a bit after that correction a while back.
The Netherlands is just going ballistic.
We do need to keep it in perspective though. While the raw numbers do show
the Netherlands to be going orbital, the per million figures are still a lot
less than Sweden's.
Global Movers and Shakers...
I will present the top fifty nations with the most New Cases and New
Fatilities.
Here we go...

India led out in both metrics again yesterday, by a wide margin in one
and a fairly substantive amount in the other.
If things don't change with regard to India's case momentum, it will replace
the United States as the nation with the most Declared Cases roughly six
weeks out.
Global osChina Stats / w 10 Day Agveraging / Fr: 03/05
Requested by: Texas Eagle
This data and chart presents things in a little different way. In the
chart it is easy to see the relationship of these numbers.
The Chart will use the data all the way back to 03/05, but the data
displayed here will only go back one month.

Here is the chart to match.
This chart revealed more of a flattening, but no more. There have been some
drops in the numbers of Active Cases, and then the size of their increased
numbers as they grow recently. Both are good signs of a more healthy situation.
In the United States chart like this one, the Recoveries, and Resolved
Case lines have not shown near the strength as is revealed here with these
upward bound lines.
That chart is provided here, in a small version, but you can see it full size
if you right click view.
Section: 04
The Following Addresses the Global Numbers
including Mainland China*
Mainland China's numbers are 0.002% of today's total global numbers.
A Look at Declared, Resolved, and Active Cases, Includes M/L China
End of day figures follow:

We rose to a 77.169% level of Resolved Cases yesterday Globally.
I like these resolved rates have said so, but with so many cases having been
declared, we could have a 90.00% level of Resolved Cases, and still have a lot
Active Cases.
Fatalities, Recoveries, Resolved, Active, and Serious/Critical
Cases Globally, Including M/L China
Concept of adding in Active Cases and
Serious/Critical here, courtesy of amorphous

Active Cases rose up again yesterday, and Serious/Critical cases
rose up also.
Section: 05
the Mortality Report
Here is the data for four entities...
Here are the figures for the growing case totals for four entities.

We hear all sorts of stories about how these figures are wildly off. The CDC
has studied them and seems to think they may actually be on the low side of
things. I am providing the CDC Provential Numbers down below. Not sure if
anyone has a rock solid number. I doubt it is possible. This is what is
reported out by WoM and JHU. Check out the CDC numbers too.

Charts like this one only show growth. That's why I recently took the advice
of a FReeper and added in a new chart for the U. S. and Global outside China
regions.
Here are figures revealing the daily growth for those four entities.

The numbers of Fatalities rose up as we ventured deeper into the work week.


Since the beginning of COVID-19's activity in the U. S., higher New Cases were
soon followed by elevated Fatalities. If we have gone to school on the data
of this disease, we know who should avoid exposure the most. So if the
demographic that has little to fear from the disease is out there getting
infected, it may not be a bad thing at all. If the Fatalities remain low,
vastly higher cases may simply increase the rapidity of the saturation of the
people in public who have already fought it off. And that may facilitate the
end of the disease. I'm sure others know this, but I did want to explain why
my thinking has fluctuated over time regarding these dynamics.
Here, let's look at data for the United States broken out by itself.

Our Fatalities figures rose significantly yesterday. We're just along for the
ride folks.
As back seat drivers, we're pretty helpless back here.

Seems like we've settled into a Ground-Hog day situation here, living the same
COVID-19 day over and over and over...
Section: 06
Population Saturation
Here are figures revealing how many people in each population base represent one
case. I'm also showing what percent of each population base is infected at this
time.

While we are still slipped off and on, we're still doing much better than weeks
back.
Nations With Lots of Cases
At the end of the day yesterday, there were:

I expanded the levels here yesterday. We had nations who were seeing serious
growth, and their levels weren't showing up very well at the top.
Over 50% of the 215 nations we're tracking now, have declared over 5,000 cases,
but they have far lees of them still Active. Over 25% of the nations we're
tracking have delared over 50,000 cases along the way. None of them have
anything near their declared amount remaining active. Keep that in mind.
Daily Case Report Evaluation
I'll be keeping tabs on the daily tallies for days of the week for a while. Folks have
noticed some patterns of larger and smaller data entry on certain days, and on Fridays
sometimes the numbers get noticeably larger because of it.
And we now know Thursdays have potential to break out also. Yikes!
IMO Let's check out the numbers and a chart.


This was fourth day out of the last 20, that we did not set a new record for
the day, or an all time record. The thing is, the last three days the
totals come in lower than previous highs. There is a good chance we will
see lower numbers this week. Hopefully so...
Section: 07
The Top 200 Counties in the U. S., by Number of Cases
This little report lists 200 Counties in the United States in declining Case numbers.
There is also a listing that is alphabetical. This report list only the entities
and the number of Cases in the two different sorts.
It will also be available as a downloadable Excel file in Section 12.

For months Puerto Rico was showing up with the Counties. That stopped in early July
if memory serves me well.
Section: 08
States of the Union and the District of Columbia, Compared to Each Other
Each of these pages is sorted differently. Look at the red header above
the columns to see which column was used for the sort on any given page.

For your review...

For your review...

For your review...

For your review...

For your review...

For your review...

For your review...

For your review...

For your review...
If this area interests you, please use this LINK to the source, and review
the lengthy description and explanation of it's development process.
There are two reports. The presentation above comes from the second one,
and the detailed segmented information below it, may interest you.

These can now also be found under the states on the Alphabetical list. The
states and these entity's numbers should be combined to match that of the
U. S. figures each day.
Section: 09
The United States, Where it Ranks With Other Nations?
Each of these pages is sorted differently. Look at the red header above
the columns to see which column was used for the sort on any given page.
The U. S. will be highlighted red here so we can find it easily in the list.
There was 215 nations on this list last night now. I didn't want to post
seven lists with 215 nations on it, so I picked the top 50. Coincidentally,
one report category had the U. S. at 41st, so it wasn't showing up on the
list with the 31 top nations on it. That wasn't the reason why I extended the
list length, but it did work out well.
I work on the nations right next to the states on my spreadsheet. The
states with the District of Columbia come in at a total of 51 lines.
I decided to keep the international reports near that length, and 50
was good enough.
Here we go... for your review.

For your review...

For your review...

For your review...

For your review...

For your review...

Around 06/23, China started putting out it's testing numbers. I thought
they were suspect. The number they put out was 90,410,000. Ours and most
everyone else's numbers are specific. For instance on 06/28, our number of
of tests at the ned of the day was 32,592,368. That specificity separates it
from the number China put out. It was rounded to the 10 thousandth place. In
addition, China has not updated that number once. So I do not inlude China in
the Nation's Comparison Sort regarding Testing, and any place that reports out
global testing numbers for a top level comparison.

We remained in 20th place here yesterday.
Over the last couple of months we've been in this rut from 19th to 16th place.
Now we're at 20th place for three days in a row.
Section: 10
Here is what it is all about. From January 20th to the present.

This concludes our look back at yesterday's data. Take care...

Section: 11
Data for this Report Sourced From:
LINK WorldoMeters
LINK Johns Hopkins University
The Center for Systems Science and Engineering (CSSE)
LINK United States Center for Disease Control - Provisional Numbers
Listed in the order of current utilization...
LINK You are Invited to Review My COVID-19 Spreadsheet (XLSX)
There is not an XLS version available for distribution at this time.
Section: 12
Other Features:
LINK US Counties200, States & DC51, Territories & Other Entities11, Nations219,
and the CDC Provisional Counts53
Five Excel Spreadsheet datasets you can sort for your own studies...
Section: 13
Links to other resources:
I cannot vouch for these sites. Please use your own judgement.
LINK Adventist Health Coronavirus Resource Hub - Scroll down for useful info
LINK Antibiotic Vitamin, the (Vitamin D)
Good article on Vitamin D's likely role in prevention of infection. Thanks Blam.
LINK CDC Data for Download - Scroll down - Excel required. Includes death stats.
LINK CDC National Center for Health Services
Provisional deaths as determined by review of vital documents. Much lower...
LINK CDC Secondary Data and Statistics - Portal Entry / Look around
LINK Coronavirus (COVID-19) Map
LINK Coronavirus infection risk may be reduced by Vitamin D
by Former CDC Chief Dr. Tom Frieden
LINK Coronavirus Spread Quickly Around the World in Late 2019, Study Shows
the University College London Genetics Institute
LINK COVID-19 Deaths Broken Out by Thirds, 05/07/20 Map of US Counties
Very revealing display of Concentrated Death Zones - thanks hoosiermama
LINK COVID-19 First U.S. Case, Treatment, features Remdesivir
New England Journal of Medicine article
LINK Cytokine Storm, med Actemra, Physician near death saved
LINK Diamond Princess Review at 634 Case Point of Eventual 712
LINK Hydroxychloroquine Article: International Poll
Daily Mail Reports, Most Effective Treatment According to 6,000 Physicians
LINK Hydroxychloroquine Has about 90 Percent Chance of Helping COVID-19 Patients
the Association of American Physicians and Surgeons, reports 91.6% of patients improved clinically
LINK IHME - Institute for Health Matrix and Evaluation
LINK National Institutes of Health - Cornavirus (COVID-19)
LINK Nasal Irrigation is the Key, COVID-19 Related
LINK New York City - interesting breakdown, borough, age, sex
LINK On the Origin of CCP Virus, A Documentary Movie (turn up the sound)
Epoch Times: I highly recommend this very well documented report.
LINK Rt COVID-19
Calculates and displays the Rt Factor for each state. Thanks FreedomPoster.
LINK World Health Organization

Dr. Ramin Oskoui, cardiologist and CEO of Foxhall cardiology, who is a regular in Laura Ingraham’s medical cabinet, mentioned on her show today an important blog for stuff on Fauci and the gain-of-function saga. every page of the blog I try to link to comes up with:
“Internal Server Error”
presumably, this is the page:
Heraclitus on covid-19 blog: Gain of Function Research Gone Bad
https://heraclitusoncovid19.com/gain-of-function-research-gone-bad/
here is the CACHED VERSION:
Heraclitus on covid-19 blog: Gain of Function Research Gone Bad
by Heraclitus/
September 13, 2020
Here is a question. On January 9th, 11 days prior to the inauguration, the Obama Administration felt strongly enough about GOF research that they published this guidance. Why was this so important to them to get done prior to the change of government?
In the answer to that question, we now suspect, lies the seeds of everything that now has come to pass, and perhaps the likely outcome of the coming election.
Obama White House GOF deliberation announcement https://obamawhitehouse.archives.gov/blog/2014/10/17/doing-diligence-assess-risks-and-benefits-life-sciences-gain-function-research
NIH Pause Announcement http://www.phe.gov/s3/dualuse/Documents/gain-of-function.pdf
Obama White House Final Statement https://obamawhitehouse.archives.gov/blog/2017/01/09/recommended-policy-guidance-potential-pandemic-pathogen-care-and-oversight
Obama White House Policy Guidance on PPP potential GOF researchhttps://obamawhitehouse.archives.gov/sites/default/files/microsites/ostp/p3co-finalguidancestatement.pdf
Guidelines for Dual Use Research of Concern http://www.phe.gov/s3/dualuse/Documents/durc-companion-guide.pdf
Biden responsible for China’s entry into the WTO as Chair of Senate Foreign Relations Committee 2001 https://www.nytimes.com/2020/09/06/us/politics/biden-china.html
Dr. Baric’s thoughts in 2014. https://www.npr.org/sections/health-shots/2014/11/07/361219361/how-a-tilt-toward-safety-stopped-a-scientists-virus-research
Something going on in China in November https://abcnews.go.com/Politics/intelligence-report-warned-coronavirus-crisis-early-november-sources/story?id=70031273
Fauci weighed in in 2012, he knew all about it https://mbio.asm.org/content/3/5/e00359-12
Why didn’t he ever share his concerns with the American public now?
The SARS-CoV-2 pandemic supports the thesis that the moratorium on Gain-Of-Function experiments with infectious agents of pandemic potential was unwise.
(1) We did not need GOF experiments to tell us that zoonoses of an animal coronavirus had pandemic potential.
(2) Most GOF experiments with coronaviruses would not have permitted us to develop vaccines or therapeutics any faster than we are now doing. Consider what in hindsight would have been the most obvious GOF experiment with a bat coronavirus — insertion of a polybasic cleavage site. Acquisition of the PCS by SARS-CoV-2 almost certainly has been important for human-to-human transmission, but it’s not a useful target for vaccines and even if targeting the host-cell proteases that cleave the PCS proves to be useful, we didn’t need GOF experiments to tell us this.
(3) If we had done GOF experiments with animal coronaviruses and found the mutated viruses to be more transmissible in an optimized animal model, it is unlikely to have had sufficient influence to increase research funding and therefore would have not increased pandemic preparedness in the way that you envision.
(4) There’s a good argument that we should have invested more in pan-coronavirus drug development, but again, you don’t need GOF experiments for that. Maybe you need chimeric viruses for animal testing, but I don’t know if these qualify as GOF, and it’s not obvious to me that these are critical path experiments.
In summary, we still think the onus is on GOF supporters to provide solid and specific arguments that the benefits outweigh the risks.
Source: PA Department of Health
Stats as of midnight September 29/30
LTC deaths = 5456 (increase of 20)(!!!)
Total deaths = 8142 (increase of 19)
LTC as percentage of total = 67% (slight increase from 66.9%)
As has happened too many times, the LTC subset is greater than the (total) set. These “statistical adjustments” only serve to exacerbate the abysmal record of Wolf & Levine by elevating the percentage of LTC deaths.
At this point I am inclined to attribute them to utter incompetence rather than malfeasance.
30 Sept: Reuters: Travel slump threatens 46 million jobs, aviation group says
By Reuters Staff
PARIS - The impact of the coronavirus on travel may cost as many as 46 million jobs globally, according to projections published on Wednesday by an aviation industry group.
The Air Transport Action Group (ATAG) predicted that the travel slump and a slow recovery will threaten 4.8 million aviation workers and more than half of the 87.7 million total jobs supported directly or indirectly by the sector, in related leisure industries and supply chains...
Airlines are pressing governments to abandon quarantines and other travel curbs blamed for worsening the slump, and instead roll-out rapid COVID-19 testing at airports.
https://in.reuters.com/article/health-coronavirus-airlines-study/update-1-travel-slump-threatens-46-million-jobs-aviation-group-says-idINL8N2GR493
Deaths is the vest info we have but...
https://twitter.com/TheLawyerCraig
“Of all the resident deaths Florida reported today:
11.9% of them occurred in the last week
10.1% occurred 1-2 weeks ago
12.6% occurred 2-3 weeks ago
8.2% occurred 3-4 weeks ago
Which means 57.2% deaths—reported today—occurred more than 4 weeks ago!”
Imteresting person to follow.
Thanks. More statistical noise...
So many people have an angle on this. LOL
Did you know that if you buy specially designated boxes of
Cracker Jacks...
Appreciate your work.
The info on this is abominable.
I’m getting very frustrated at sites, like mine in Va, that only give cumulative stats. What good is 8 or 9 month old info now?
Oh well, it’s been that way all along.
Exactly!
The premise this guy was mentioning isn’t surprising to me.
None the less, I find some of these things to be provided
for their own sensationalist impact.
The other day someone mentioned that all people who die of
motor vehicle accidents are listed as COVID-19 deaths if
they are found to be infected.
Okay, let’s think about that. Lets say 25,000 people so
far this year have died of motor vehicle accidents. If
the average population base of around 6.00% of them were
infected with Covid-19, that means that around 1,250 to
1,350 were infected. And them you have to consider that
not all of them would have been reported as a COVID-19
death despite that possiblity. Then you have to realize
that 2/9ths of these total deaths, occurred before COVID-19
was a thing here. That causes the 25,000 number to drop
by 2/9ths.
So everyone throws their hands up to their mouth and thinks,
“My oh my these death figures are way out of whack!’, even
though at most 1,250 out of 208,000 deaths could be thought
to have been misdiagnosed.
These well meaning people, are skewing trust in the
numbers.
As I said, they may mean well, but what they are doing is
creating chaos. Folks can’t trust anything because people
keep coming up with things that sound devastating to the
count, but really aren’t when you get down to it.
Last one. Thanks everyone for reviewing these. Many in my area are still coming down with COVID. I have a close cousin going on three weeks in ICU with lung damage (a lung perforation). Her 02 dropped as low as 50% at one point - still refused intubation.
Lately, new case numbers are averaging about 0.5% per day. Fatalities are averaging a little below this number according to WOM data. Risk by age increases exponentially. Stay safe y'all !
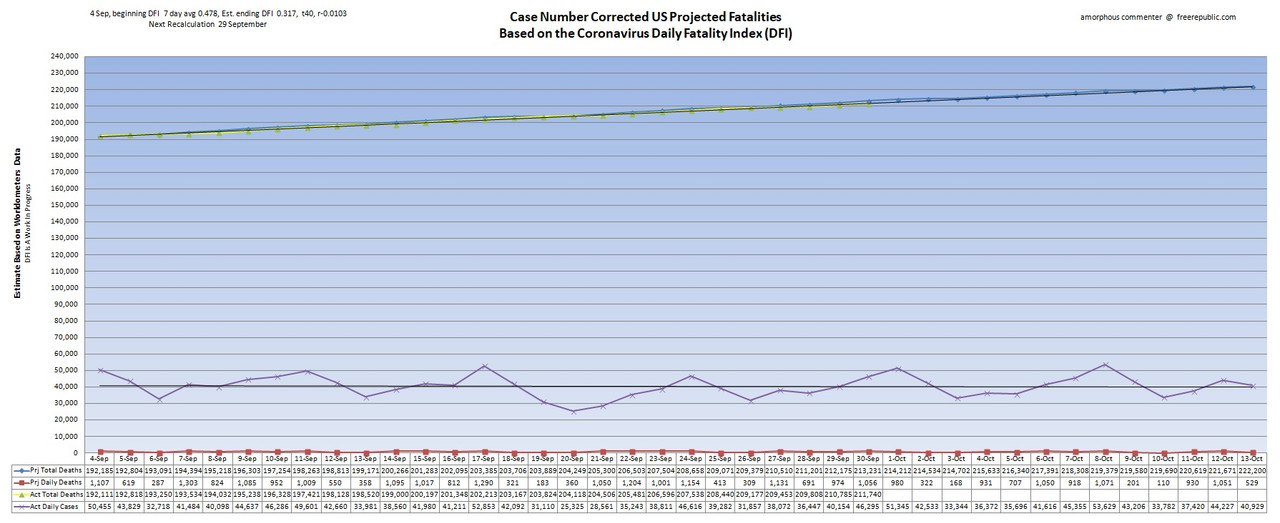
•Blue line represents projected death totals.
•Yellow line is actual death totals based on WorldofMeters.info data.
•Purple line is actual daily cases offset by 14 days.
•Red line represents projected daily deaths.
•Black extension lines are trend lines.
So sorry to hear about your cousin.
Prayers being said.
Thank you for the ping and the info.
Thanks JL. We’re very worried for her. Take care!
Just got word that she isn’t going to make it. It’s been three weeks since she was diagnosed with COVID. They’re making her comfortable. This IS still a killer. Prayers appreciated.
Very sorry to hear that.
My condolences.
So sorry to hear this.
My thoughts and prayers are with you and your family.
Prayers sent
Thank you. My cousin was a perfectly healthy lady just a few weeks ago and isn’t a large woman and had no underlying issues that I know. Both she and her husband had it, and he is older, but he is better now. I’ve heard of other older couples in our area where both the husband and wife died. COVID may end up being compared to the Spanish Flu before it’s over.
Thank you. Your prayers are very much appreciated. The family is with her, but it’s not looking good. The doctors are not giving much hope though miracles still happen every night and day. She’s a nice person and close friends with my wife. She will be greatly missed by many.
Disclaimer: Opinions posted on Free Republic are those of the individual posters and do not necessarily represent the opinion of Free Republic or its management. All materials posted herein are protected by copyright law and the exemption for fair use of copyrighted works.