
Posted on 04/08/2020 2:59:43 AM PDT by DoughtyOne
PING LIST
Some of you have asked to be placed on the COVID-19 Update Ping List. Those who give me a
request, will be placed on the list before the next Update is posted.
If a person has expressed an appreciation for the data I'm presenting, I may add that
person to the Ping List.
Some folks don't like to be on ping lists, and I won't mind if you would rather I remove your name
from the list.
COVID-19 Update
As of 04/07/2020 23:17 PDST (taken at 23:59)
Good morning everyone.
Thank you for stopping by to check out this Update.
Be on the Lookout for Somethings New:
A Few Graphs, and Workups on States, Territories, & Counties
Links to other resources: Near the bottom of this post.
Commentary2: Interesting Tid-bits (hopefully)
The United States Crosses Another Milestone Associated with COVID-19
Around midnight this morning PDST, the United Statew passed by the 400 thousandth milestone
case, of COVID-19 on it's soil.
The Issue of New Cases Leveling Out or Dropping
Lets address this issue a little more.
There has been talk over the last few days about a flattening, and perhaps a pull back from the
larger numbers across Europe. Yesterday Morning I kind of grudgingly acknowedged some of that.
I don't like to build false hope. It did seem like there was movement downward, but here we are
today and things don't look quite so rosy. I had thought we were seeing a bit of a retreat, but
it's more accurate to say there is somewhat of a flattening. I don't like using the same phrase
over and over, but once again, we'll have to watch the next few days for things to clarify.
Lets look at some numbers, and a graph to go along with them.
Here: (case growth)
-
         Global    Global (EC)
      Excluding          Minus             the
          China      the U. S.           U. S.
03/29    58,481         38,955          19,826
03/30    62,463         40,868          21,595
03/31    73,836         48,832          25,004
04/01    77,502         50,405          27,097
04/02    78,548         49,710          28,838
04/03   102,458         69,559          32,899
04/04    84,954         51,111          33,843
04/05    71,866         46,465          25,401
04/06    72,272         41,534          30,738
04/07    83,630         52,077          31,553

Numbers did dip on the fourth and fifth of the month. Yesteray they rose again. Granted, they
didn't break new ground, but if they continue to go in that direction, we mqy break some soon.
As it is, things look fairly level if you toss out that massive number on the third.
Not sure what that was all about.
So, stay tuned...
The Following Addresses the Numbers Here in
the United States of America
Yesterday's Growth Rate Rose Back Up
Declared Cases in the United States
             EOD    DAY'S  INCR'SD
DATE       CASES    GRWTH   GROWTH
-
03/20     19,624    5,374      539
03/21     26,747    7,123    1,749
03/22     35,206    8,459    1,336
03/23     46,442   11,236    2,777
03/24     54,893    8,789   -2,427
03/25     60,197   13,966    5,177
03/26     85,991   16,794    2,828
03/27    104,839   18,848    2,054
03/28    124,665   19,826      978
03/29    143,025   18,360   -1,466
03/30    164,620   21,595    3,235
03/31    189,624   25,004    3,409
04/01    216,721   27,097    2,093
04/02    245,559   28,838    1,741
04/03    278,458   32,899    4,061
04/04    312,237   33,779      899
04/05    337,638   25,401   -8,378
04/06    368,376   30,738    5,337
04/07    399,929   31,553      815
For the last five days we've been hanging in there around the 30,738 to 33,779 mark. We had risen
Fatalities, Recoveries, Resolved, & Serious/Critical Cases
in the United States
                                               ACTIVE     SERIOUS
DATE       FATAL       RECOV      RESOLV        CASES    CRITICAL
-
03/20        252         152         404       19,220
03/21        329         176         505       26,242
03/22        396         178         574       34,632
03/23        428         178         606       45,836
03/24        581         354         935       54,296
03/25        753         619       1,372       67,825
03/26      1,301       1,868       3,169       82,822
03/27      1,704       2,622       4,326      100,513
03/28      2,229       3,231       5,460      119,205
03/29      2,488       4,562       7,050      135,975
03/30      3,170       5,507       8,677      155,943
03/31      4,055       7,251      11,306      178,318
04/01      5,112       8,878      13,990      202,731       5,005
04/02      6,095      10,403      16,498      229,061       5,421
04/03      7,403      12,283      19,686      258,772       5,787
04/04      8,454      14,825      23,279      288,958       5,870
04/05      9,620      17,977      27,597      310,041       8,702
04/06     10,943      19,810      30,753      337,623       8,983
04/07     12,875      22,711      34,586      365,343       9,169
The numbers continue to grow. There's some very bad and some rather decent news behind them.
Our Slice of the COVID-19 Pie Continues to Grow
Time to take another moment to address the U. S. portion of the global declared cases.
The U. S. has roughly 4.252% of the global populace. There are two
figures I'm tracking with regard to this, the Declared Cases and the
Active Cases.
Here is what those numbers looked like at the end of the day yesterday.
       DECLARED     DAY'S     ACTIVE     DAY'S
DATE      CASES      CHGE      CASES      CHGE
-
03/20    7.125%    1.297%    10.934%    1.552%
03/21    8.704%    1.579%    13.000%    2.066%
03/22   10.377%    1.673%    15.343%    2.343%
03/23   12.170%    1.793%    17.411%    2.068%
03/24   13.053%    0.883%    18.369%    0.958%
03/25   14.657%    1.604%    20.190%    1.821%
03/26   16.140%    1.483%    21.454%    1.264%
03/27   17.530%    1.390%    22.920%    1.466%.
03/28   18.742%    1.212%    24.126%    1.206%
03/29   19.762%    1.020%    25.289%    1.163%
03/30   20.936%    1.174%    26.777%    1.488%
03/31   22.045%    1.109%    27.885%    1.108%
04/01   23.110%    1.065%    29.120%    1.235%
04/02   24.160%    1.050%    30.482%    1.362%
04/03   24.886%    0.726%    31.057%    0.575%
04/04   25.935%    1.049%    32.400%    1.343%
04/05   26.464%    0.529%    32.866%    0.466%
04/06   27.324%    0.860%    34.153%    1.287%
04/07   27.930%    0.606%    34.854%    0.701%
These percentages are still troublesome. If the global body of the populace does
The Following Addresses the Global Numbers
without Mainland China
Global Cases Increased to Record Levels Today, Outside M/L China
Yes, back to still more numbers...
               EOD      DAY'S   INCR'SD
DATE         CASES     GROWTH    GROWTH - compared to day before
-
03/20      194,148     30,824     5,185
03/21      225,932     31,784       963
03/22      257,820     31,888       104
03/23      297,172     39,352     7,464
03/24      341,530     41,462     2,110
03/25      390,378     48,848     7,386
03/26      451,006     60,628    11,780
03/27      516,124     65,118     4,490
03/28      583,107     66,983     1,865
03/29      641,588     58,481    -8,502
03/30      704,051     62,463     3,982
03/31      777,887     73,836    11,373
04/01      855,389     77,502     3,666
04/02      933,937     78,548     1,046
04/03    1,036,395    102,458    23,910
04/04    1,121,349     84,954   -17,054
04/05    1,193.215     71,866    13,088
04/06    1,265,487     72,272       386
04/07    1,349,117     83,630    11,358
If we look back at the first though the seventh, we can see pretty level figures there. Today I'm
Cases continue to go up.
Fatalities, Recoveries, Resolved, Active, and Serious/Crical Cases
Globally, Excluding M/L China
                                               ACTIVE     SERIOUS
DATE       FATAL       RECOV      RESOLV        CASES    CRITICAL
-
03/20      8,110      16,393      24,503      169,645
03/21      9,740      19,995      29,735      196,197
03/22     11,305      25,485      36,790      221,030
03/23     13,060      28,470      41,530      258,538
03/24     15,347      35,256      50,603      290,927
03/25     17,643      40,467      58,210      332,168
03/26     20,785      48,084      68,869      382,137
03/27     24,466      56,801      81,267      434,857
03/28     27,522      64,777      92,299      490,808
03/29     30,714      76,342     107,056      534,532
03/30     34,515      89,989     124,504      579,547
03/31     39,052     102,121     141,163      636,724
04/01     43,949     118,092     162,041      693,348
04/02     49,838     135,204     185,042      748,895
04/03     55,611     150,014     205,625      839,770
04/04     61,466     170,309     231,775      889,574      41,993
04/05     66,183     185,921     252,104      941,111      45,633
04/06     71,485     208,635     280,120      985,367      47,201
04/07     78,812     224,264     303,076    1,046,041      47,743
The numbers of resolved cases have risen to over 300,000 cases now. Globally outside China, there
Special Section on France, Germany, Italy, and Spain
Case growth.
Lets Look at Some Numbers in Five Day Increments:
DATE       FRANCE      GERMANY        ITALY       SPAIN
-
02/20          12           16            3           2
02/25          14           18          322           9
03/01         100          117        1,128          76
03/06  --     653  --      670  --    4,636  --     401
03/11       2,284        1,966       12,462       2,277
03/16       6,650        7,272       27,980       9,942
03/21      14,485       22,364       53,578      25,496
03/26  --  29,566  --   43,938  --   80,589  --  57,786
03/31      52,819       68,180      105,792      94,417
04/05      93,780      100,123      128,948     131,646
04/07      98,984      103,375      132,547     136,675 > 2 days not five

I think it's interesting to look at how these nations have progressed in relation to each other.
I know it looks like some of these nations are pretty far apart, but all it takes is a couple of
days when one nation goes hot, and another cools off, and they'll be close to each other again.
I'll continue to monitor these nations and document the numbers here.
Sweden and It's Neighbors, Who Has the Best Tactic Againt COVID-19
I'll be repetitive here.
Sweeden adopted a plan that institued social distancing and continuing to work,
through the virus. They do take special measures with compromised people, the
elderly and others with known problems. This kept their economy largely in tact.
Those who can are encouraged to work remotely.
Here are some numbers to help us look at this issue.
DATE      SWEEDEN      DENMARK      FINLAND      NORWAY
-
02/21           1            0            1           0
02/26           2            0            1           1
03/02          15            4            6          25
03/07  --     161  --       27  --       19  --     156
03/12         599          617           59         702
03/17       1,196        1,024          321       1,471
03/22       1,934        1,514          626       2,385
03/27  --   3,069  --    2,700  --    1,041  --   3,771
04/01       4,947        3,290        1,446       4,877
04/06       7,206        4,875        2,176       5,865
04/07       7,693        5,266        2,308       6,086
-
Deaths        591          203           34          89
-
Populas     10.33m        5.82m        5.53m       5.37m

Sorry to be repetitive again here in this next paragraph. The one after that moves into new ground.
This has particularly interested me, because this is more the direction I would have preferred, to
the direction we took. Looking at how things have gone so far, I'm not convinced I was right. The
one thing about Sweeden's plan, is that economy keeps on going. When the disease has run its course
there, everything will basically be in tact.
I note that Norway has a much lower mortality figure than Sweden, for the amount of cases in which
they aren't all that far apart. It's roughly 6.1 thousnd to 7.7, and yet there is an 8.9 to 59.1
ratio of deaths between them. I'm not sure how Sweden's policies might impact that. Am I missing
something?
There will be a lot to hash out when COVID-19 has fully come and gone.
I'll keep an eye on this dynamic, and add to the above numbers daily.
The Following Addresses the Global Numbers
including Mainland China*
Mainland China numbers make up 00.21% of today's cases globally
Nations With Lots of Cases
At the end of the day on 04/07/2020, there are:
 1 nation(s) with 400,000 plus (take a bow...)
 4 nation(s) with 100,000 to 199,999
 3 nation(s) with  50,000 to  99,999
 3 natiom(s) with  20,000 to  49,999
 6 nation(s) with  10,000 to  19,999
10 nation(s) with   5,000 to   9,999
35 nation(s) with   1,000 to   4,999
There are currently 62 nations with a 1,000 count or above...
A Look at Declared, Resolved, and Active Cases, Includes M/L China
End of day figures follow:
           DECLAR     DAY'S  RESOLVED    DAY'S   PCT DEC      ACTIVE
DATE        CASES    GROWTH     CASES   GROWTH  CS RESOL       CASES
-
03/20 -   275,434 -  30,911 -  99,655 -  3,590 - 36.181% -   175,779
03/21     307,280    31,846   105,425    5,770   34.309%     201,855
03/22     339,259    31,979   113,540    8,115   33.467%     225,719
03/23 -   381,621 -  42,362 - 118,369 -  4,829 - 31.017% -   263,252
03/24     423,121    41,500   127,538    9,169   30.142%     295,583
03/25     472,109    48,998   136,178    8,640   28.845%     335,931
03/26 -   532,788 -  60.679 - 146,749 - 10,571 - 27.544% -   386,039
03/27     598,070    65,282   159,533   12,784   26.675%     438,537
03/28     665,164    67,094   171,077   11,544   25.720%     494,087
03/29 -   723,740 -  58,576 - 186,060 - 14,983 - 25.708% -   537,680
03/30     786,291    62,551   203,926   17,848   25.933%     582,383
03/31     860,181    73,890   220,713   16,085   25.659%     639,468
04/01 -   937,783 -  77,602 - 241,591 - 20,878 - 25.762% -   696,192
04/02   1,016,401    78,618   264,935   23,344   26.066%     751,466
04/03   1,118,921   102,520   285,706   20,771   25.534%     833,215
04/04 - 1,203,923 -  85,002 - 312,068 - 26,362 - 25.931% -   891,855
04/05   1,275,856    71,933   332,513   20,445   26.062%     943,343
04/06   1,348,184    72,328   359,618   27,105   26.674%     988,566
04/07   1,431,900    83,716   383,688   24,070   26.796%   1,048,212
I do believe we have seen a leveling out of growth in the global and U. S. figures. Having said
Look at the percentage of resolved cases. It has finally broken out of the mid to upper 25.500%
range. Here's to hoping we'll see that figure continue to grow over the coming days.
Fatalities, Recoveries, Resolved, Active, and Serious/Crical Cases
Globally, Including M/L China
                                               ACTIVE     SERIOUS
DATE       FATAL       RECOV      RESOLV        CASES    CRITICAL
-
03/20     11,399      88,256      99,655      175,779
03/21     13,049      92,376     105,425      201,855
03/22     14,706      98,834     113,540      225,719
03/23     16,563     101,806     118,369      263,252
03/24     18,919     108,619     127,358      295,583
03/25     21,308     114,870     136,178      335,931
03/26     24,077     122,672     146,749      386,039
03/27     27,761     131,772     159,533      438,537
03/28     30,852     140,225     171,077      494,087
03/29     34,018     152,042     186,060      537,680
03/30     37,820     166,088     203,908      582,383
03/31     42,354     178,359     220,713      639,468
04/01     47,261     194,330     241,591      696,192
04/02     53,160     211,775     264,935      751,466
04/03     58,937     226,769     285,706      833,215
04/04     64,795     247,273     312,068      891,855      42,288  ch 295
04/05     69,514     262,999     332,513      943,343      45,898  ch 265
04/06     74,816     284,802     359,618      988,566      47,412  ch 211
04/07     82,145     301,543     383,688    1,048,212      47,932  ch 189
Overall numbers continue to rise in every categore, but the next step is watching the numbers
Population Saturation
Here are figures revealing how many people in each population base represent one case. I'm also
showing what percent of each population base is infected at this time.
ENTITY              PER 1 CASE  DY BEF YES  DY BEF THT    CHG YEST  CHG DY BEF
-
Globally      :          7,413       7,860       8,237        -447        -377
Outside China :          7,428       7,885       8,256        -543        -371
The U. S. A.  :            904         979       1,066         -75         -87
-
ENTITY         INFECTION LEVEL  DY BEF YES  DY BEF THT    CHG YEST  CHG DY BEF
-
Globally      :       00.0127%    00.0120%    00.0114%    00.0007%    00.0006%
Outside China :       00.0164%    00.0154%    00.0147%    00.0010%    00.0007%
The U. S. A.  :       00.1106%    00.1022%    00.0938%    00.0084%    00.0875%
These saturation rates are troubling. The percentge of our populace infected is too, when you
States of the Union, the District of Columbia, and Territories...
I still have this available in the Excel format, linked below. I thought folks might like to
have access to it here. I list the states alphabetically. On the right side of that listing is
the ranking number in the list by descending cases. Look up your state alphabetiall, get that
number, and look at the list on the right to find look at how the other states stand next to
yours.
Here is the Standing of 200 Counties in the U. S.
I still have this available in the Excel format, linked below. I thought folks might like to
have access to it here. I list the Counties alphabetically. On the right side of that listing is
the ranking number in the list by descending cases. You can look to see if your county is listed.
Hopefull not. If you find it, you can look at the numberical list to compare to other counties.

This concludes our look back at yesterday's data. Take care...
Data for this Report Sourced From:
LINK Johns Hopkins University
The Center for Systems Science and Engineering (CSSE)
LINK WorldoMeters
LINK You are Invited to Review My COVID-19 Spreadsheet (XLSX)
There is not an XLS version available for distribution at this time.
Other Features:
LINK US States DC51, Territories5+, and Counties200
Excel Spreadsheet with Alphabetical and Numerically descending Cases
Links to other resources:
I cannot vouch for these sites. Please use your own discression.
LINK Adventist Health Coronavirus Resource Hub - Scroll down for useful info
LINK CDC Secondary Data and Statistics - Portal Entry / Look around
LINK Coronavirus (COVID-19) Map
LINK COVID-19 First U.S. Case, Treatment, features Remdesivir
New England Journal of Medicine article
LINK Diamond Princess Review at 634 Case Point of Eventual 712
LINK earlyAlert
LINK Hydroxychloroquine Article: International Poll
Daily Mail Reports, Most Effective Treatment According to 6,000 Physicians
LINK IHME - Institute for Health Matrix and Evaluation
LINK National Institutes of Health - Cornavirus (COVID-19)
LINK New York City - interesting breakdown, burough, age, sex
LINK World Health Organization

Greeat work, D1.
Please put me on your list.
(No, not that one, your ping list. Sheesh.)
If not already on list, please add.
Lotta work there....great!
Well they’ve been saying this will be a bad week. They were right.
It's a log graph, note the left side.
Nobody I am aware of does a better job of graphing all the date.
John Burn-Murdoch @jburnmurdoch Stories, stats & scatterplots for @FinancialTimes | Daily updates of the coronavirus trajectory tracker | john.burn-murdoch@ft.com

Seriously, thank you for all of the hard work that went into compiling these statistics. It is very much appreciated.
Wonderful. Please add me to you ping list.
“These percentages are still troublesome. If the global body of the populace does
have a plateau and then a drop, that will impact this, with our slice of the pie
growing larger and larger. Hopefully we’ll have our own plateau.”
I am ignoring those percentages. My guess is that most nations are no better, or worse at getting people tested (the ONLY thing that creates a new “official” case) and that China has lied about its official numbers and/or is not doing massive testing. I cannot in all honesty accept the “U.S. share” as realistic. There is too much that is NOT done to identify ALL “cases” in ANY country.
Many many thanks for your analysis and data !!!
It now looks like Covid-19 can be passed to cats, and from cats to cats, and probably from cats to humans.
Got any feral cats in your area? In the future they might be a Covid-19 reservoir, like ground squirrels are for Bubonic Plague. So your feral cats get Covid-19, and pass it to your indoor/outdoor cat, who comes inside and gives it to you.
Chris Martenson talks about it today on his Covid update starting about 3 minutes in.
https://www.youtube.com/watch?v=VUiUH7uaAM8
Thanks for the update DoughtyOne. The model Dr. Birx has relied on in the past, https://covid19.healthdata.org/united-states-of-america ,
is now projecting 60,415 deaths in the USA. This is a drop of over 20,000 from yesterday.
Nice work, DoughtyOne!
I particularly found useful the County Analysis. I used that to find the “hot spots” for Covid-19 and then went over to the U.S. Census Bureau QuickFacts:
Notice how easy make it for me to send a link to the counties I looked at!
Learned that counties with high Asian populations such as Gwinnett County are seeing lots of cases. The biggest concentration of Asian supermarkets are in Gwinnett. Great place to go.
Staying tuned. Thank you. Will check you out tomorrow.
BkMk data later
Maybe so, but this particular disease kills by causing the autoimmune system to flood the lungs. I'm not sure that the arrival of spring by itself will solve our problem.
There are some things working in our favor. Many people are being more careful. Therapy drugs are working and vaccines are coming.
From a health point of view, time is on our side because such pandemics run their course and go away. But can the economy wait much longer? I don't think so, and that is why Trump is pushing on the medical, scientific, manufacturing, and government mobilization.
Thanks for posting, please add my name to the ping list.
Yesterday, was a bloodbath for death toll. Lets hope the 2nd derivatives become more favorable and slowly turn the numbers more favorable.
Unfortunately, many do not know how to interpret real data.
They rely on Hannity and Ingram telling them that the end is sight, by giving them cherry picked items or one-day trends.
We certainly agree!! I am in the camp that says the virus runs a life of its own which can be measured in the number of days from when it began. That certainly seems to be supported by the countries I track (primarily northern Europe & S. Korea). I have not seen any studies that support a temperature change impact for this virus.
One only needs to see the world map (below). Equatorial, warmer climate, countries are infected and certainly the northern latitudes, that have not seen high temps yet, are infected. Maybe the temp fans are looking at Antarctica on the map (no reported cases) :-).
A little more time is our friend -- if we can stand it!! In my opinion, we are beginning to see that in the U.S. now just as a day count would project.
click on image to enlarge
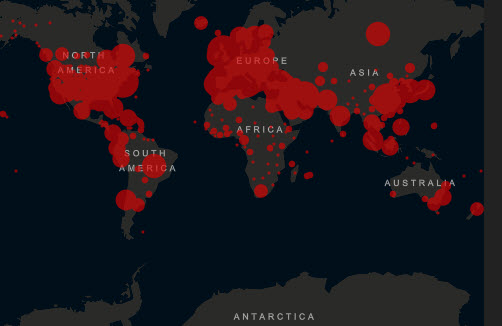
Data from Worldometer & John Hopkins
Great job!
Disclaimer: Opinions posted on Free Republic are those of the individual posters and do not necessarily represent the opinion of Free Republic or its management. All materials posted herein are protected by copyright law and the exemption for fair use of copyrighted works.
