Way to go doc!! So far so good.
Posted on 03/17/2020 4:34:32 PM PDT by gas_dr
I have spent the last several days like most Americans somewhat baffled, perplexed and even a little nervous at the rapidly unfolding events as to CoVID-19. The community seems to have been divided into two groups, those who are advocating that there is nothing more than the common flu here and that there is vast overreaction, and those that advocate that this is a serious illness that for the safety of all requires drastic measures in order to prevent mass death and tragedy. If one looks closely, it is possible to find everything from death rates calculated at 0.1% - 14% and beyond.
Fair warning, I tend to fall in the previous camp and think that this is likely an overblown situation that appears to be gathering inertia, and I have gotten into several heated and admittedly emotional arguments about this current situation. For full disclosure, I am a critical care physician practicing in the United States, and the fear of the unknown probably drives to a small degree my emotion. So this evening, I have decided to put emotion aside, and truly conduct a retrospective analysis of the data that is present in a multivariant system and see where the data lead us.
I have discovered something interesting, and will simply present the data without commentary. I have analyzed from the worldometer website six countries: China, Italy, United States, South Korea, Spain, and France. I have been curious as to the timelines and increase in daily cases in countries that appear to have rampant disease, and countries that have flattened the curve.
Methodology: Utilizing a base case rate of 100 infections, I standardized the time to 6340 infections, which happens to be the current report of United States infections updated at 1800 EDT. Datasouce: Worldometers.info
CHINA: Time to equivalent cases of United States infections: +7 days. (571 cases -> 7,711 cases). Time to Peak of newly reported cases (2nd inflection point) +15 days from current US case load. After inflection point, total new cases fell dramatically
South Korea: Time to equivalent cases of United States Infections: +15 days (100 cases - 6593 cases). Time to peak of newly reported cases (2nd inflection point) +4 days. After inflection point, total new cases fell dramatically.
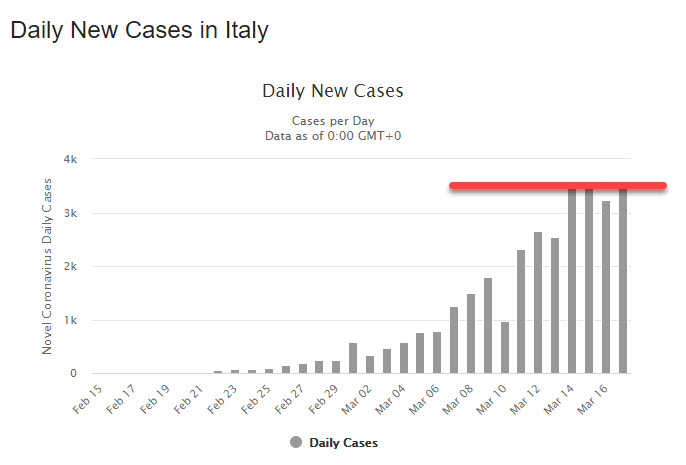
Italy: Time to equivalent cases United States Infections: +15 days. (75 - 6,387). Time to peak of newly reported cases +7 days. This is where the data may become predictive. Between March 15, 16, and 17 there was a relatively flattening of new cases and decline in the last 24 hours reported period. What will be a test of this model is what happens to the cases in this 24 hour period. According to the other models, this should be the peak.
United States: Time from 100 cases - 6340 cases +15 days. If this model is predictive, we can ascertain in the next 4 - 7 days based on number of cases and shape of curve if we appear to follow South Korea numbers, or Italian and China Numbers. The current acting head of HHS repeatedly states out numbers track South Korea.
Spain: Time from 75 cases - 6391 cases +13 days. Today is day +2 from the relatively time constant 100 -> 6500 cases period.
France: Time from 100 cases - 6633 cases +16 days. Today is day +1 from relative time constant too >6000 cases.
Analysis: At this time, in the six major countries actively reporting all cases and under greatest scrutiny, there appears to be a constant of +14 days to grow from 100 - 6500 cases. The percentage variation in this is extremely small. From the time this 15 day time constant occurs, there is divergent data to the second inflection point in countries who are reporting a decrease in overall numbers of new cases (curve flattening). That time constant is from 4 - 7 days (South Korea (4) - China (7) - Italy (7)) If this is predictive model, what we should see it a flattening of the Italian curve starting today -- that would track with China. In the United States we are between (4) and (7) days from flattening if the data hold. The divergence of cases added between day 4 and day 7 are as few as 1500 new cases as in South Korea, and as many as 20,300 new cases in Italy, which fits an exponential growth from day 4 - 7.
If the Italian numbers are flat tomorrow and the next day, the model appears will become increasingly predictive. Questions that remain to be answered: Are aggressive measures able to reduce the time to second inflection as in the case of South Korea? If so, then we can predict in America that maximal saturation will be March 21. If it trends toward China and Italy, then it will be March 24.
I will update this as data become available. I look forward to reasoned discussion regardless of personal opinion as to the scope of this pandemic.
My pronouns are he/his/him :-)
I am actually hip when I say that apparently.
Yes, that is me, denier of all things viral. I actually had to explain to my daughter that this is the original meaning of going viral....
The graphs show accumulating cases, so the flattening actually demonstrated absolute reduction in new cases. According to the data, the second infection point which is the beginning of reduction of number of cases happens anywhere from +4 to +7 days after the point we have achieved in the US today (Time constant to first inflection point) which appears to be stable across multiple and diverse populations. Clear as mud? As my economics professor used to say.
As for your second question — when can you go to the grocery store, unlike most of the people how are quite concerned, I trust you to make the proper judgment for you, and think that the government should stay the hell out of it.
So you are “Cisgender” then...”When you identify with the gender you were assigned at birth.” Yeah I almost added “or ?” to “Man/Woman” in my post, but decided to leave at the traditional “2”. I am old school.
Yes, Cisgender/he/his/him
I suppose this makes me ripe for re-education camp. I also (gasp) like women. Add lily white male to that, and I guess I am evil incarnate.
I’m a few years behind you and my ticker’s fine.
That being said, I go at oh dark hundred on a Sunday morning. the place has been cleaned and the stockers are nearly done.
Just me and a half dozen employees and maybe one or two other shoppers.
The profane are sleeping off Saturday night, and the pious are preparing for church...
Could be worse, you could be a Florida Man!
Properly normalizing the variables may not affect the slope of the graphs that much, but I would have to see it to believe it. Without proper normalization of all the significant variables, it is just garbage in - garbage out. Although superficially impressive, this presentation amount to little more than "my guess is better than your guess".
I don't think we can believe the Chinese graphs for a minute but I suppose that is all we have to work with. The others should compare more honestly. It would be nice to see Germany and GB in there as well.
I have to say I’m suspicious of the Chinese numbers, it’s like the whole thing just basically stopped, just like that, bang, it’s virtually done in a population bigger than US Europe, Japan and South Korea combined. Tim Cook of Apple says they are fully operational there and they have been for a week, but does he even know what’s going on in his own company? Apple/China has it’s own command structure which answers above all to President-for-Life Xi.
I believe it will slow down is doing so in S Korea, but Shouldn’t rely on China data.
Yes, varying degrees of social distancing matters, and it varies in a couple of different ways that work in our favor:
1. All my European relatives are very buggy-kissy all the time, considered extremely rude to leave a gathering without a two-cheek kiss, they get in your face when you talk to them, their cultures (esp Italian, French, Spanish), while Americans, by nature have a much larger sense of personal space.
2.these other places do a LOT of bus-riding and train-riding compared to Americans and our fondness for cars. Also, we literally live much more spread out.
My hunch is that the infection rates are currently under counted by at least a factor of 10. That would drop the calculated mortality rate quite a bit.
I’m Preventive Medicine by training, my gut feeling is that there will be at least 100 million infected in this country but deaths will be much less than a million.
Finally a sensible look and prediction of what to look for...
Way to go doc!! So far so good.
“Properly normalizing the variables may not affect the slope of the graphs that much, but I would have to see it to believe it. Without proper normalization of all the significant variables, it is just garbage in - garbage out. Although superficially impressive, this presentation amount to little more than “my guess is better than your guess”.”
Yes, you are correct, it is impressive. We shall soon see how accurate it will be.
My bet is on the doc.
IC Clearly
icclearly :"Yes, you are correct, it is impressive. We shall soon see how accurate it will be.
My bet is on the doc."
True that !
International statistical analysis of other countries, used to predict when the US covid-19 (Wuhan) infection 'plateau' will occur.
Eliminating Chinese covid-19 statistics is necessary due to unreliability, prior history, and the politicization of those statistics.
One of our great heroes in this area is Justin Lessler PhD at Johns Hpkins. He is with the AIDS Research Center there in Baltimore and he is an associate professor at Johns Hopkins Bloomberg School of Public Health.
From his page there:
“The major focus of my research is the development and application of statistics, dynamic models and novel study designs to better understand and control infectious disease. In particular, I am interested in creating synergies between infection control practice, data collection and infectious disease dynamics. Exemplary of this goal, my collaborators and I have developed methods to estimate the distribution of incubation periods for an infectious disease using coarse data, applied these methods to develop the best available estimates for a number of viruses, and showed how these estimates can be used to improve infection control practice.
My current research projects include work on the transmission dynamics of influenza in southern China, and the most effective use of vaccine in the control of measles and cholera. “
His email is jlessle1@jhu.edu but I expect he is quite busy these days..
Here is a link to the IDEA equation if you want to read about it. I think you will see why people think this approach works. Its at science direct and there is a pdf link at the top of the page:
https://www.sciencedirect.com/science/article/pii/S1755436516300305
Disclaimer: Opinions posted on Free Republic are those of the individual posters and do not necessarily represent the opinion of Free Republic or its management. All materials posted herein are protected by copyright law and the exemption for fair use of copyrighted works.