 |
 |
 |
 |
 |
Posted on 02/21/2010 3:26:53 PM PST by blam
Five Graphs On Japan, U.K. And U.S. Economies
by: Econ Grapher
February 21, 2010
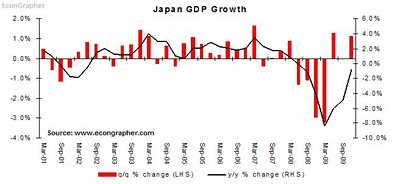
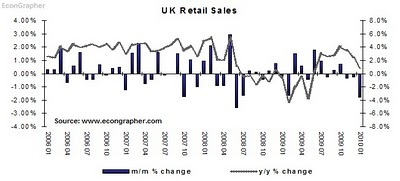
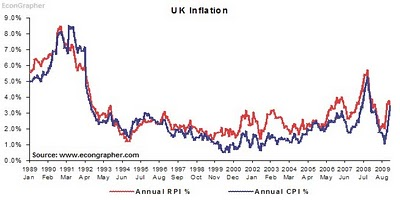
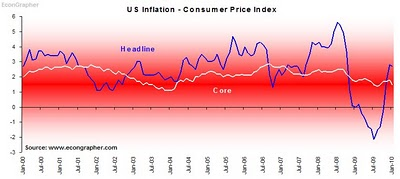
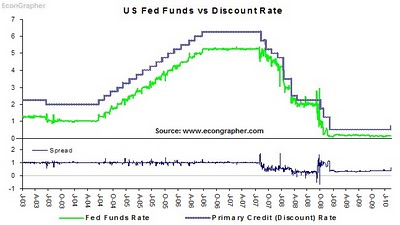
This week we look at Japanese GDP figures which show an improving situation, poor performance in UK retail sales, a lift in UK inflation, a pause in US inflation, and the start of the US Federal Reserve testing the exit strategy waters in policy normalisation. So thematically I suppose we've got a bit of a growth and inflation slant this time.
Thus we've got what were for a time the 3 main financial centers in this article, where the growth situation is mixed; the UK really just struggling along, Japan benefiting from global trends in stimulus and presently largely artificial pick ups in demand, while the US is still in economic limbo - what happens when the stimulus is gone?
Meanwhile, on the inflation front, things are currently also largely mixed. The UK is probably the leader of the three on current inflation, while the US is a close second, and Japan is still in deflation. The risks to accelerating inflation are similar in the US and the UK, but as we'll see in the US the Fed has been making some promising moves towards preventing sowing the seeds of more powerful inflationary pressure in the years to come.
[snip]
Gotta go to work ping.
blam,
Don’t trust that US CPI number, do your own math. Math isn’t subjective unless it is from .gov, or CNBC.
http://www.market-ticker.org/uploads/2010/Feb/cpi-bad.png
CPI Number Reported INTENTIONALLY INCORRECT?
Remember the market’s “cheering” of the “-0.1%” CPI-U reading (core) yesterday?
There’s a problem - it was wrong.
Look at the highlighted numbers. Let’s multiply them up.
(5.966 x 0) + (.769 x -2.1) + (25.206 x -0.1) + (.347 x 0.4) / 32.288 = -0.12%, or -0.1%.
But it was reported as -0.5% in the line directly above (inverted tone.)
Oops.
I didn’t re-run the weightings for the entire series but a quick “eyeball” of the table shows that this should result in a CORE reading of 0.1% (positive), not the negative number reported.
Will the BLS admit to this error? Who the hell knows, but if you have a calculator, you can verify that yet another game to “boost” the market was run, with desire effect - a roughly 1/2% spike in the S&P 500 futures right on the BOGUS data release.
Since this table is undoubtedly computed (indeed, if I was to dump the raw data into EXCEL I could have a spreadsheet do this literally in a fraction of a second) it calls into question whether this was an accident or an intentional distortion of the data at the BLS.
It also leads to a few other questions, none of which are very comfortable to consider, but all of which, unfortunately and in light of this report, we must.
For example, is the BLS simply publishing whatever the government wants it to, and then making up the numbers inside the report to hit that target? Even a simple high-school cheat knows that you must “fix” the constituent numbers that go into a cheated result in order to not get (easily) caught; in a world where people don’t add things with calculators but instead have computers sum up columns and do the math it is essentially impossible that this sort of “mistake” is an error.
Rather, it is virtually certain that this “reported” value was in fact intentionally false, and the persons doing so were too clumsy to “fix” the evidence behind it so that it would “add up.”
We now officially live in a world where intentionally-incorrect data is published by our government for the specific intention of misleading the markets.
PS: This will, of course, be used to screw Social Security recipients out of their lawfully-mandated cost-of-living increases. Count on that. Oh, and don’t ask about the money you already got screwed out of from other similar “errors” that neither I or anyone else caught because they weren’t so clumsy as to fail to cover it up.
|
|
|
|
|
Disclaimer: Opinions posted on Free Republic are those of the individual posters and do not necessarily represent the opinion of Free Republic or its management. All materials posted herein are protected by copyright law and the exemption for fair use of copyrighted works.