Posted on 01/29/2008 11:13:13 AM PST by E. Pluribus Unum
Download original article here.
A Global Temperature History of the Past Two Millennia
Reference
Loehle, C. 2007. A 2000-year global temperature reconstruction based on non-treering proxies. Energy and Environment 18: 1049-1058.
What was done
Using data from eighteen 2000-year-long proxy temperature series from all around the world that were not developed from tree-ring data (which provide significant interpretive challenges), the author (1) smoothed the data in each series with a 30-year running mean, (2) converted the results thereby obtained to anomalies by subtracting the mean of each series from each member of that series, and then (3) derived the final mean temperature anomaly history defined by the eighteen data sets by a simple averaging of the individual anomaly series, a procedure that he rightfully emphasizes is "transparent and simple."
What was learned
The results obtained by this procedure are depicted in the figure below, where it can be seen, in the words of its creator, that "the mean series shows the Medieval Warm Period (MWP) and Little Ice Age (LIA) quite clearly, with the MWP being approximately 0.3°C warmer than 20th century values."

What it means
Loehle notes that "the 1995-year reconstruction shown here does not match the famous hockey stick shape," which clearly suggests that one of them is a poorer, and the other a better, representation of the truth. Because of its simplicity and transparency, as well as a host of other reasons described in detail by Loehle -- plus what we have learned since initiating our Medieval Warm Period Record-of-the Week feature -- it is our belief that Loehle's curve is by far the superior of the two in terms of the degree to which it likely approximates the truth.
Reviewed 30 January 2008
It will be interesting if research continues to find some variable that accounts for the oscillations and resolves some of the contentions that seem to be driven by political expediency.
200 years ? So I take it now that we are considering the Steam Engine as a significant AGW factor ?
Well, get your head around it: it’s not only AGW, it’s acid ran from coal fired generators in China and ocean-dumped mercury form South America, and CO2 from Indian cars.
We’ve sort of conditioned ourselves to deplore any sort of controls on such activity because heretofore we have been the primary beneficiaries of evading full accounting for such externalities.
From this point forward however, we well be increasingly on the receiving end of the externalities, but without any of the economic gains accruing to the countries producing them.
And somehow we are going to have to negotiate some sort of international arrangements to share the pain of reducing everyone’s aspirations to archive dependence on a type of economy and carbon based energy regime that’s simply unsupportable as increasing numbers of people attempt to emulate it.
Unfortunately, “Dems da’ facts” of the basic environmental science.
And the politics of working through them - both domestically and internationally - are going to be *very* contentious.
How do you know he’s a witch?
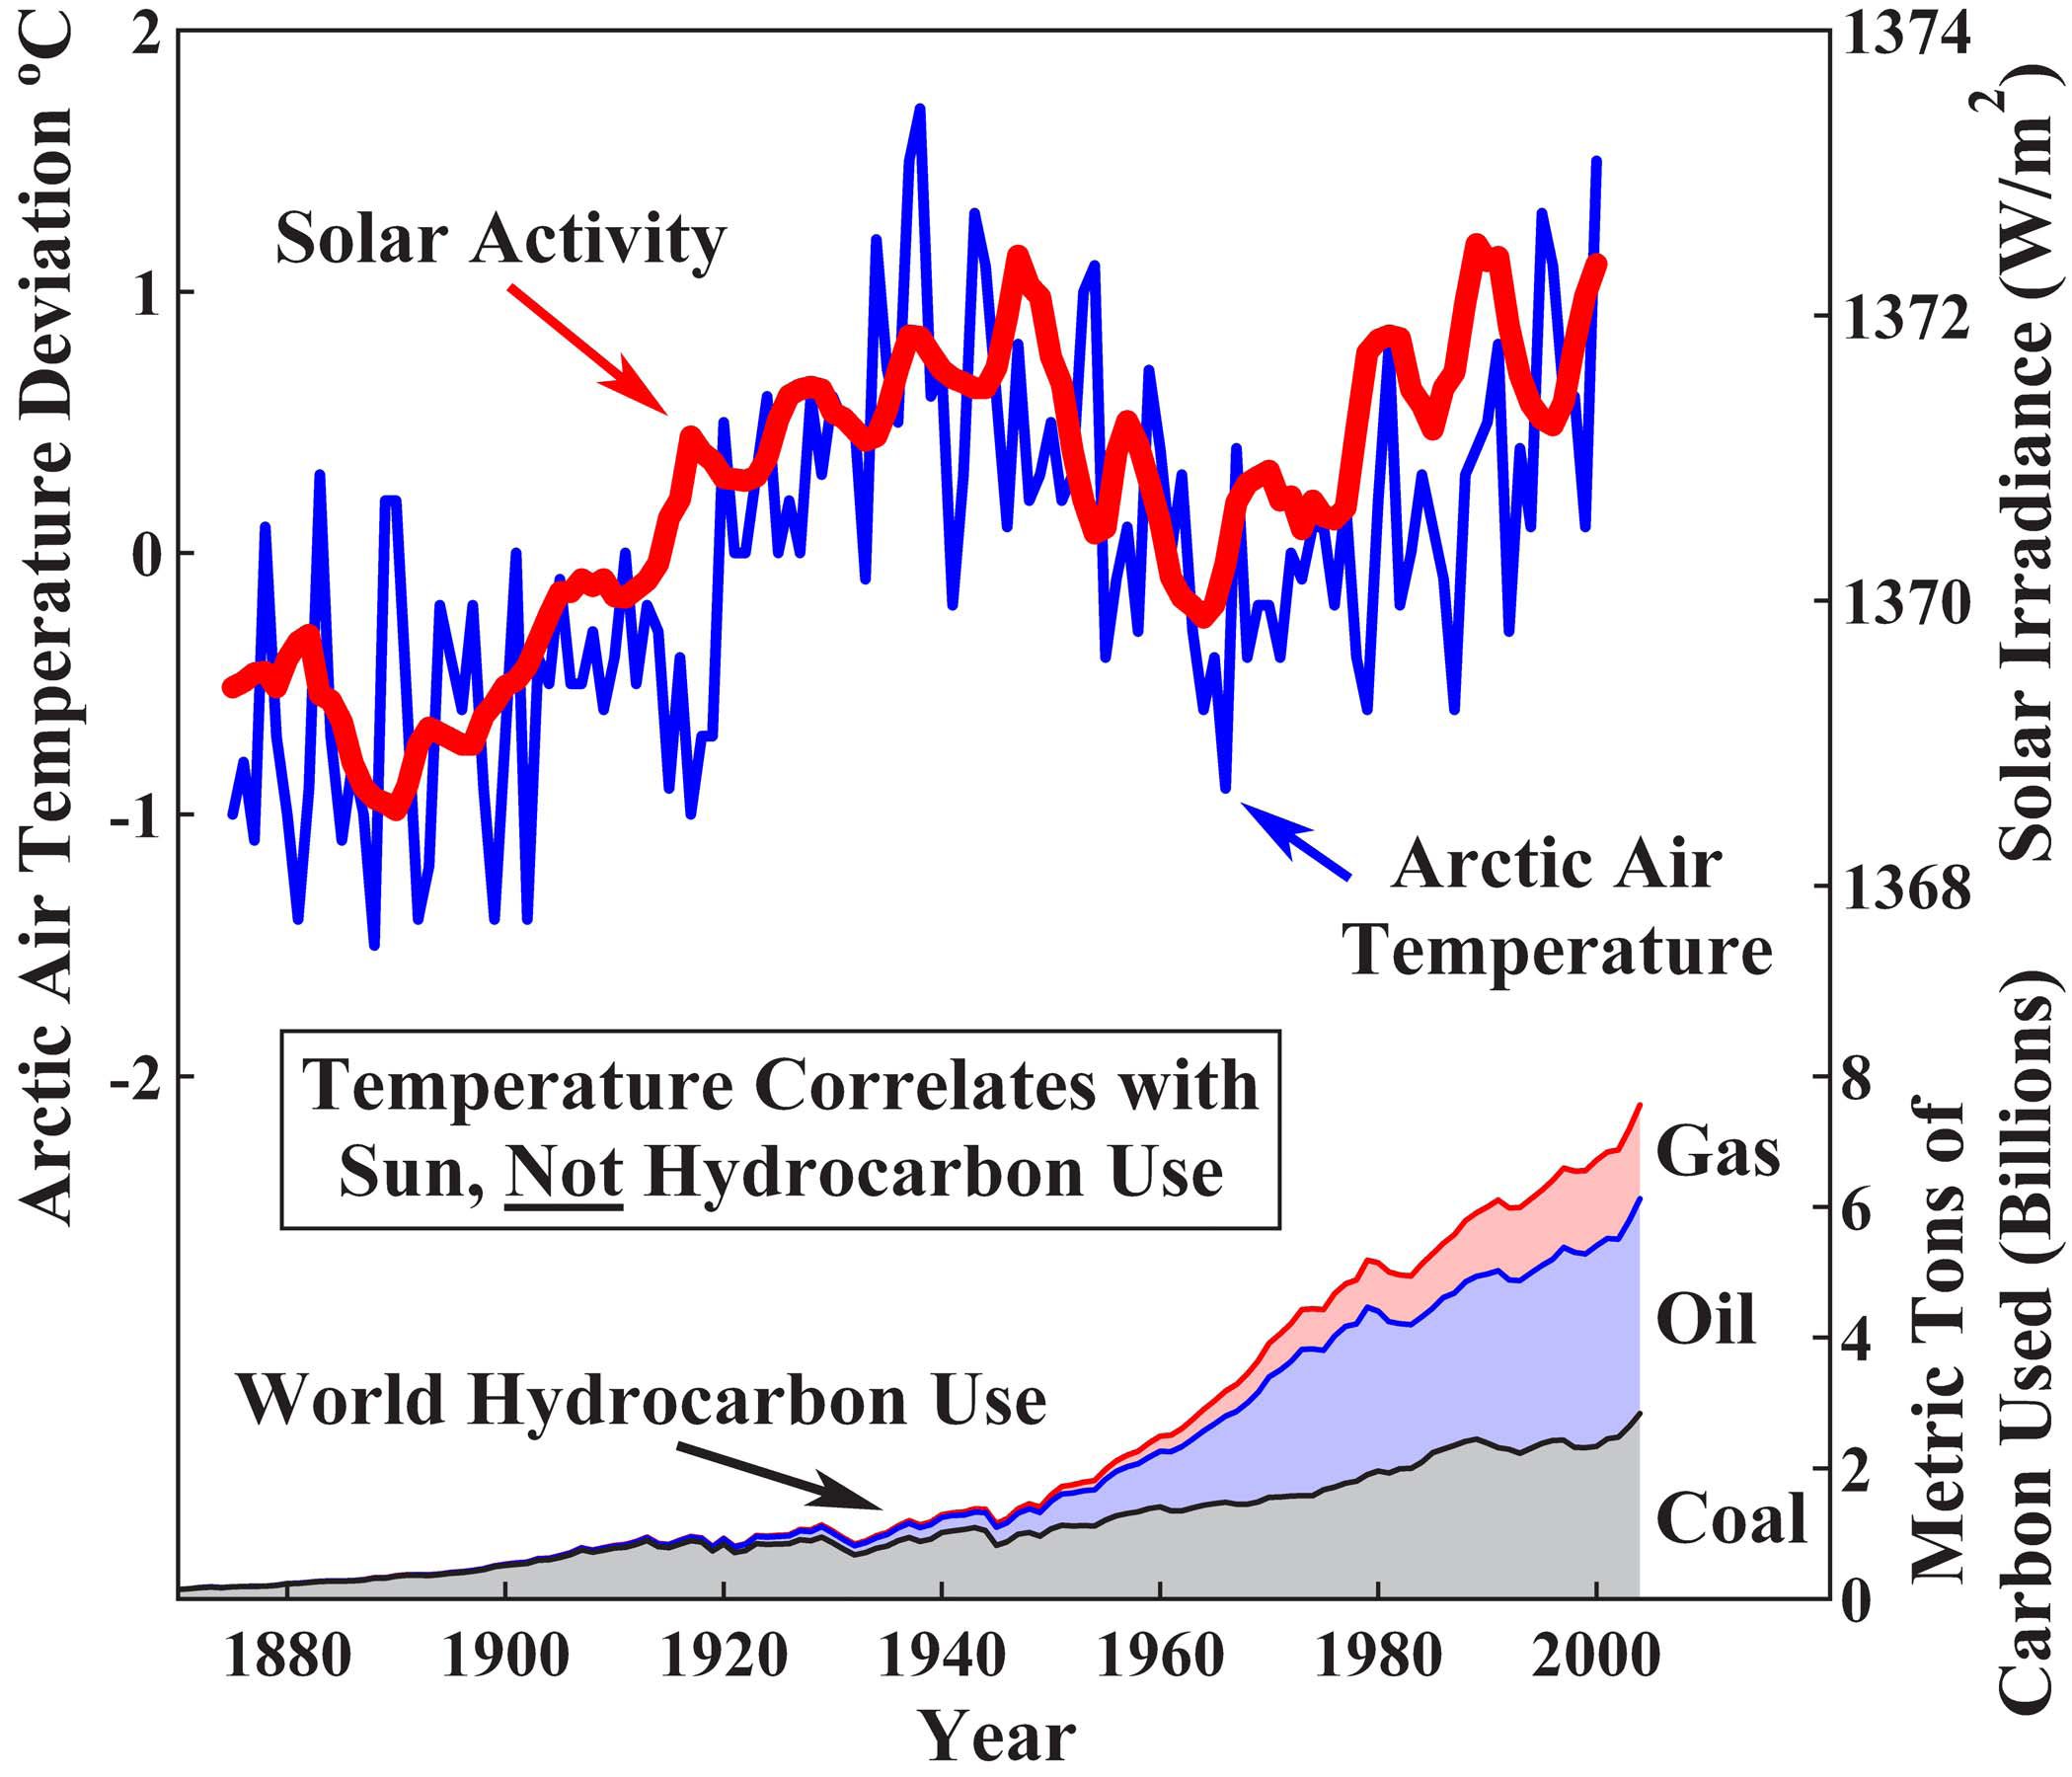
1800 forward is roughly the point at which industrial economies first began to produce significant quantities of CO2 and other GHGs to the atmosphere. And yes, the increasing use of coal - largely for the production of steam power - was one of the first major industrial contributions. It took about 50 years forward from that point for things to really take off.

Sorry about the size of that image, but total hydrocarbon use occurring today makes the hydrocarbon use prior to 1900 stattiscally insignificant.

Fixed it.

But hey, Al, his lawyers, and their crooked scientists got paid so who cares?
Thanks for the image fix. The belief that CO2 levels are the significant driving factor for global temperature trends also requires an explanation for why the temperatures fell during the 1950’s while CO2 levels were rising. From what I have read, their explanation involves aerosol and particulate pollutants that were released during that time frame. The belief that solar activity is the significant driving factor for global temperature trends requires no other qualification. It is the best fit. Just look at that chart. Solar activity was the leading factor determining arctic air temperature trends.
There are isotope proxies for sunspots, and I believe they've been characterized and tabulated using ice core data.

bookmark
Concerning the future sunspot activity, NASA is predicting that Solar Cycle 25 (cycle 24 is just starting) will be a very weak cycle based on measured plasma belt current velocities. So 2020-2033 should see very low solar activity. Ironically, solar cycle 24 looks to also be starting late and weak. Coincidently we just had a cold winter in the Southern Hemisphere and in many areas of the Northern Hemisphere this currently looks to be a cold winter. I am living in the Los Angeles area but the weather here has been what Seattle normally experiences. China right now is trying to keep people warm and is running low on mined coal.
Why in the world would you assume that? IMO very clear is that this will be a political process, both internally within countries and in their negotiations with each other.
Disclaimer: Opinions posted on Free Republic are those of the individual posters and do not necessarily represent the opinion of Free Republic or its management. All materials posted herein are protected by copyright law and the exemption for fair use of copyrighted works.