|
|||||||||||||||||||||||||||||||||||||||||||||||||||||||||||||||||||||||
|
|||||||||||||||||||||||||||||||||||||||||||||||||||||||||||||||||||||||
Hearing from my Mont.County (OH) chairman that the "internals" number on Bush in OH he's hearing is +8. That jibes with two other "internals" reports I've heard, one from the Voinovich campaign doing separate polling.
Its really more like 53% B - 46% K, which sounds about right. The polls tend to inflate the Democrat's level off support which is why you have to add a few points to get the correct numbers. The final outcome is going to be something approaching this stat. For the next two weeks the partisan media will tell you their findings are all over the place but when you cut through the noise, you'll find the internals are consistent. This election will offer no surprises except to Lefties who believe the country hates Bush as much as they do.

Caution.
Rassmussen still has it fluctuating between 2 and 4.
He has consistently run lower numbers through September when the MSM was trying to create a "comeback" for Kerry in October.
They were saying 7 to 11 and Rasmussen kept his regular, plodding 2-4 percent lead.
Complacency is the enemy.
Better safe than sorry.
And this from Oregon: President Bush has opened a five-point lead on Democratic rival John Kerry in Oregon in the closing weeks before Election Day, according to a new poll of likely statewide voters conducted by a prominent Portland pollster.
http://www.kgw.com/news-local/stories/kgw_101704_news_riley_poll.a2a337c.html
I am truly baffled since Bush has always been way ahead of Kerry. However, the latest projection (Oct. 17) shows Kerry securing 318 EVs on election day and Bush just 220.
What is most suspicious is that the home page used to have a direct link to the Nov. 2 EV projection, which is updated daily. About a week ago I noticed the link disappeared. In order to see the new projections, I simply change the date to today's date in the URL, and the latest graph appears.
Has anyone else been following electoral-vote.com, as I have, and are just as perplexed?
If anything, the Bush numbers should be increasingly more favorable, not heading south.
Here's a quick comparison:
THIS SUNDAY (TODAY):
Electoral Vote Predictor 2004 (as of Oct. 17, this Sunday): Kerry 318 Bush 220
LAST SUNDAY:
Electoral Vote Predictor 2004 (as of Oct. 10, last Sunday) Kerry 203 Bush 316
Bush lost 100 EVs in their estimation, in just one week? That seems impossible.
The text below the Oct. 17 map reads, in part:
"The data are very noisy, so this map should not be taken too seriously." Then why have it?!
Any explanation, especially in light of very favorable numbers for Bush being released lately? I have no idea what's going on.
Bush bounce to the top!
BBTTT!
worked on the Bush Campaign in 2000 and I am working on it this year and I can tell you the difference is astounding. Working in Maine, the 2000 campaign had NO ground game at all. The headquarters in Bangor had a couple of older ladies, nice, but not very go get em attitudes. One phone for calls and that was it. This year is 180 degrees different. Phone banks, 72 Hour Campaign. Door to door...etc...this IS how to run a ground game and win. I am very happy with the level of organization.

Question for anyone trained in statistics…
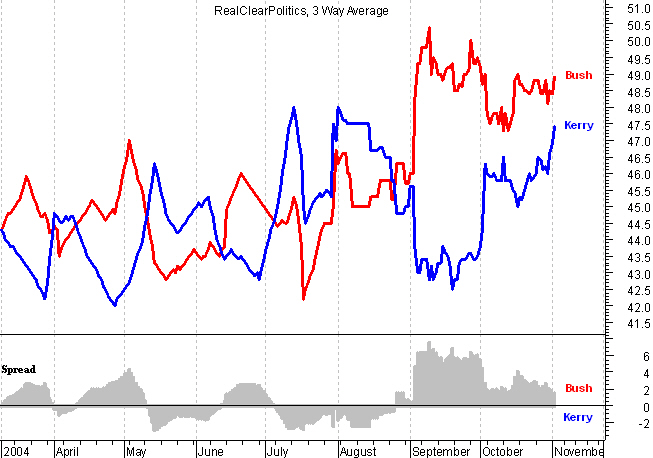
Is the margin of error reduced by combining multiple polls? Isn’t the margin of error a result of sample size? Hypothetical example:
If sampling 500 people results in a 5 point margin of error, 1000 people 4 points and 1500 people 3 points, wouldn’t combining the results of 3 polls using 500 people have a margin of error of 3 points?
I say this because Democrats are insisting that the race is a “dead heat”, within the margin of error. But those margins of error are for a solo poll, and when all are combined, the Bush lead is beyond the margin of error.