
Click here: to donate by Credit Card
Or here: to donate by PayPal
Or by mail to: Free Republic, LLC - PO Box 9771 - Fresno, CA 93794
Thank you very much and God bless you.
Posted on 11/23/2025 4:48:07 AM PST by MtnClimber
|
|
Click here: to donate by Credit Card Or here: to donate by PayPal Or by mail to: Free Republic, LLC - PO Box 9771 - Fresno, CA 93794 Thank you very much and God bless you. |
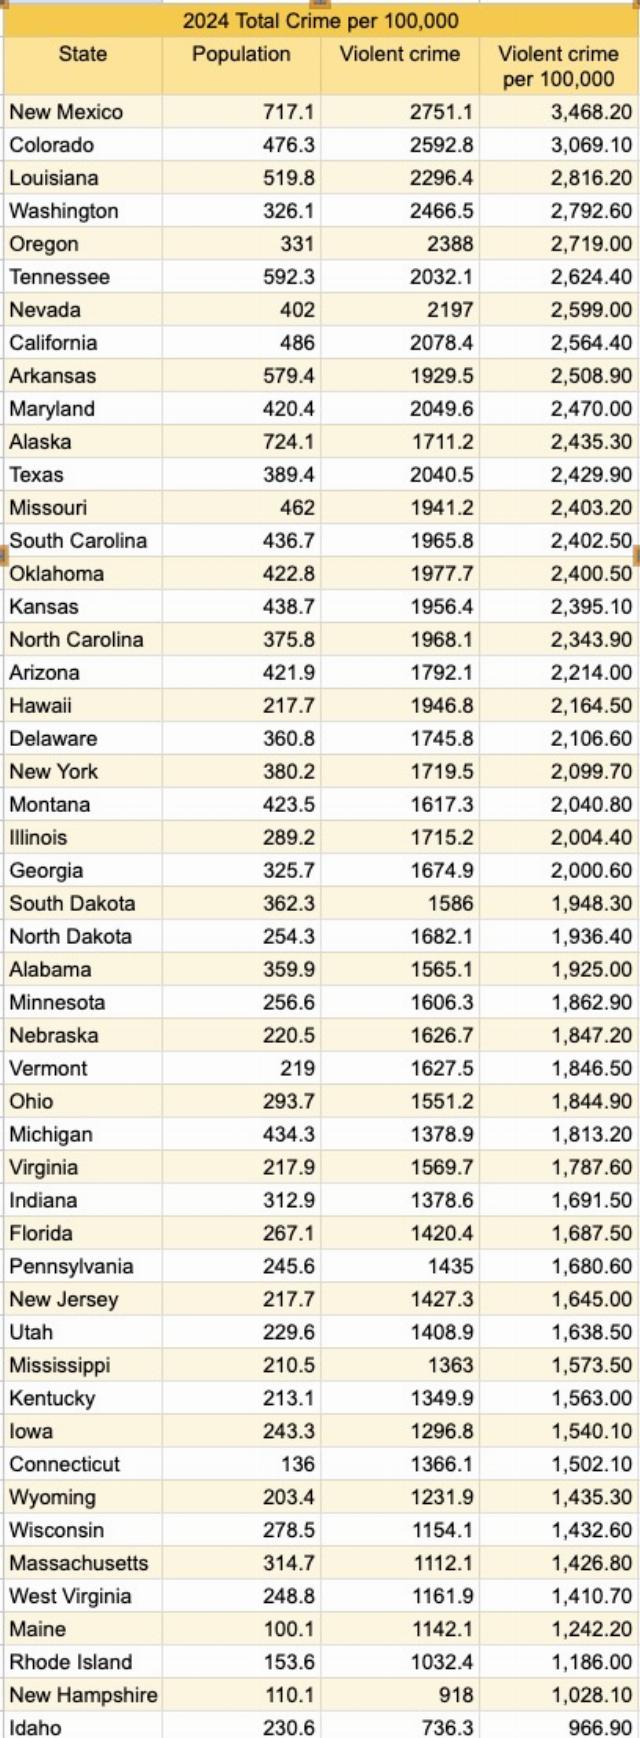
The population numbers in the yellow table seem to be off.
For a lot of states, I bet if you excluded the stats from just one major city, the whole outlook would change. For Michigan, for example, take out Detroit. I like crime maps that leave out state boundaries and just go by rural/urban.
Thank you
In the yellow chart the population column is actually the violent crime per 100,000 from the green chart.
Race may have something to do with it.
There is a way to figure out what percent of crime is not reported.
The Census Bureau conducts National Crime Surveys that just asks a statistical sample of people about crimes they have experienced.
https://bjs.ojp.gov/programs/ncvs
Those figures can be compared to “official” reports by local and state police departments as well as the FBI.
This shows Illinois has so few violent crimes that they don’t even have to bother to report them. Hey I’m moving to crime free Chicago!
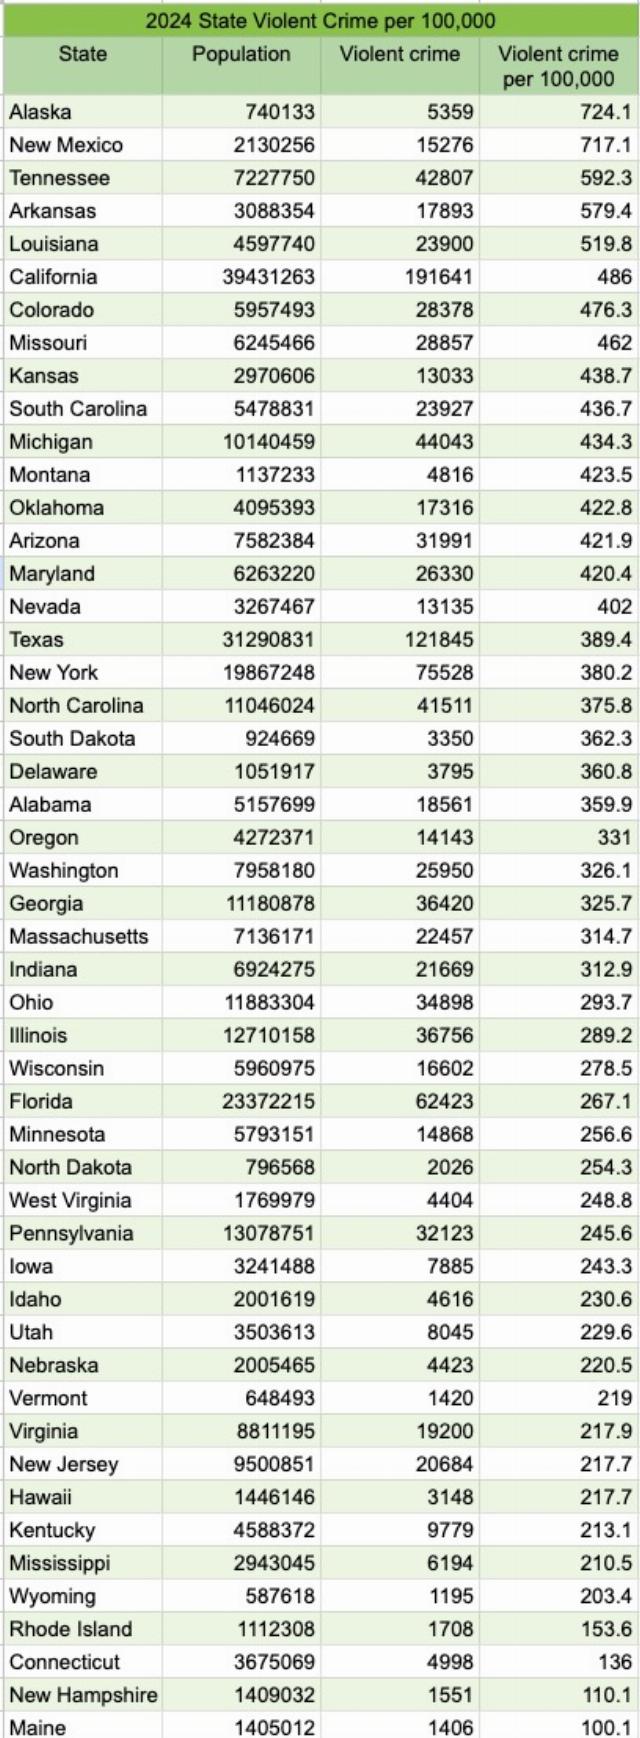
I would never have expected Alaska to be the worst for violent crime. I wonder what explains that?
Our South Bend Police Department releases a monthly statistical crime report. Having gone to the party three times so far I have found the reports to beg the questions: “What sense do you make of these statistics?” “What additional actions or changes, if any, are warranted as a result?” “Why do you give these reports?”
Probably just more honest reporting.
I would never have expected Alaska to be the worst for violent crime. I wonder what explains that?
My best guess.
Imho The natives are drawn to drugs and more likely to exhibit signs of mental illness. It's so bad, alcohol is banned in several towns.
Some of the issue is small populations make crime stats per capita skew.
New Mexico (my state) is low population and high crime, and a terrible place in certain areas, but it’s not as bad as parts of NYC for example. NYS is just so big the violence goes down per capita.
Or exclude the stats from one particular demographic.
The population numbers in the yellow chart seem to be identical with the Violent Crime per 100,000 numbers in the green chart.
I agree--these numbers don't seem plausible as presented.
Libs love to scream about crime in red states - but you need to look at the cities - specifically blue cities with blue in red states, that is where crime is concentrated.
Examples: Jacksonville, Atlanta, New Orleans, and Orlando.
Early in BeijingBiden’s term he told agencies that reporting was now voluntary. And, they could change the reporting criteria (e.g., downgrade violence from felony to misdemeanor) for any reason — like wanting to convince voters that you have decreased crime
Stats are now worthless for any locality that did this.
What’s really interesting about that data...
We don’t know how much is missing.
How many PDs are still refusing to report their crime stats to the FBI?
How many PDs are still cooking their crime stats?
Disclaimer: Opinions posted on Free Republic are those of the individual posters and do not necessarily represent the opinion of Free Republic or its management. All materials posted herein are protected by copyright law and the exemption for fair use of copyrighted works.