Posted on 05/15/2021 4:52:45 AM PDT by MtnClimber
It appears that some time last month the EPA provided a major update of what it calls its “climate change indicators.” The EPA’s web page for this is headed “Climate Change Indicators in the United States,” with the sub-heading “Climate Change Is Happening Now.” The update is an initiative of the Biden administration, now eager to invest a few trillion dollars of your money in new “green” infrastructure, after several years in which the Trump EPA paid no attention to keeping these data up to date. The New York Times reports on the big update on today’s front page, under the headline “Climate Change Is getting Worse, E.P.A. Says. Just Look Around.”
The basic technique here is to propagandize you with every sort of essentially irrelevant anecdotal information, while diverting your attention away from the only indicator of “climate change” that actually counts, which is temperature. After all, if temperatures aren’t going up, it isn’t “global warming.” Here, we have some 54 supposed climate “indicators” — everything from rain to drought to ice to sea level — out of which the things relating to actual temperature are only a handful, and then are buried deep in the midst of all the others, probably in the hope that you will miss them. And moreover, the temperature data are then grossly misrepresented in what has to be an intentional effort at deception.
But let’s start with the official line from the new Biden EPA.
The Earth's climate is changing. Temperatures are rising, snow and rainfall patterns are shifting, and more extreme climate events – like heavy rainstorms and record high temperatures – are already happening. Many of these observed changes are linked to the rising levels of carbon dioxide and other greenhouse gases in our atmosphere, caused by human activities.
The Times then picks up on the theme by its headline calling for you to “just look around” to determine that “climate change” is happening. The idea is that you can determine that there is “climate change” by observing ice on ponds, or something, without having to bother with those complicated thermometers, let alone sophisticated satellite measurements:
Wildfires are bigger, and starting earlier in the year. Heat waves are more frequent. Seas are warmer, and flooding is more common. The air is getting hotter. Even ragweed pollen season is beginning sooner. . . . [EPA’s indicators] map everything from Lyme disease, which is growing more prevalent in some states as a warming climate expands the regions where deer ticks can survive, to the growing drought in the Southwest that threatens the availability of drinking water, increases the likelihood of wildfires but also reduces the ability to generate electricity from hydropower.
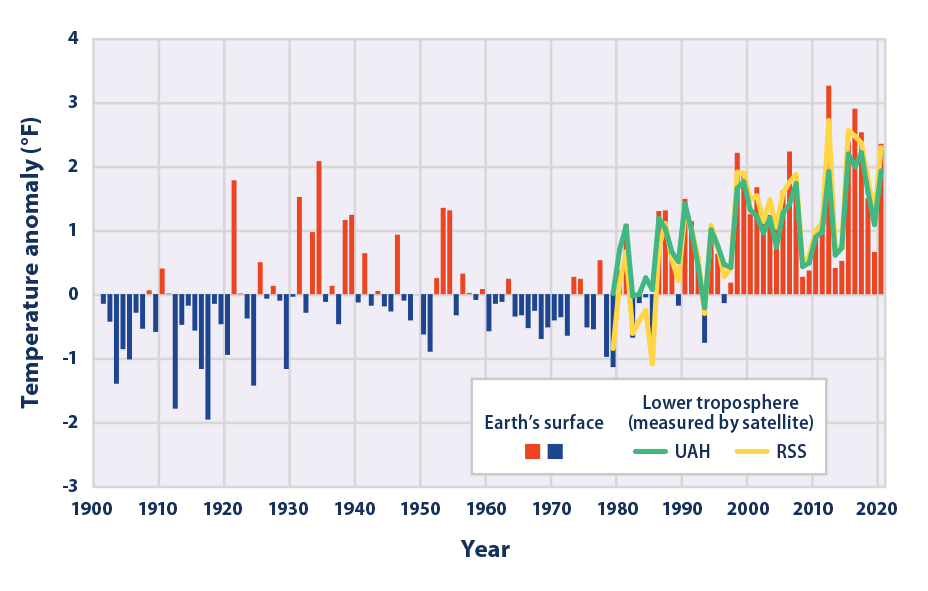
So how about the temperature guys? As you can see, the Times does throw in a couple of references to “heat waves” and “hotter air” in the midst of all the stuff about flooding, ragweed pollen, ticks, and whatever else. What’s missing is any citation or link to any source to support the assertion about actual temperatures. But over at the EPA page, under the heading “U.S. and Global Temperature,” we find the following graph, which is said to have been updated to April 2021:
That appears rather scary! Everything looks like it is going up sharply with passing time. Check out especially the green line, which is identified as the “lower troposphere [temperatures] (measured by satellite) of UAH.” The green line ends with a steep uptick, leaving it with the latest data point just below a record reached in 2016, and a full 2 deg F above the 1901-2000 average.
Oh, but here is the actual lower troposphere temperature record from UAH, available at the website of Roy Spencer, who is the guy who compiles the UAH record:
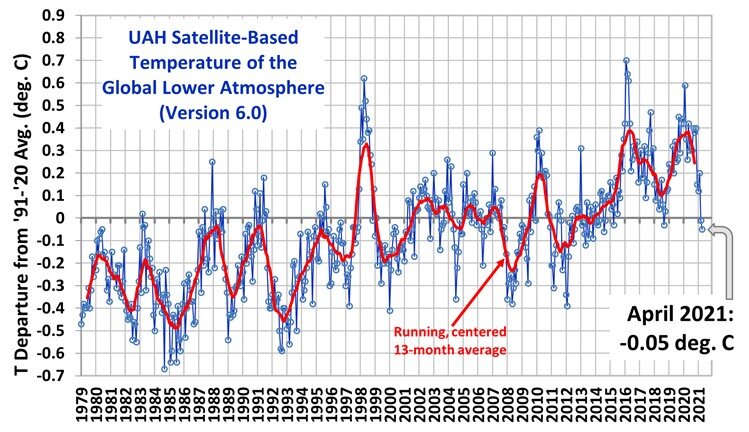
There are a few differences in the presentation that require a little interpretation, like the EPA graph is in deg F and has anomalies from a 1901-2000 mean, while the UAH graph is in deg C and shows anomalies from a 1991-2020 mean. But still, it leaps out that the green line on EPA’s web page, said to be the UAH record, ends with a sharp uptick and with the last point a full 2 deg F above the mean line; while this record, from UAH itself, ends with a sharp downtick and the last point actually below the mean line. Although EPA explicitly says on its web page that it updated the information in April 2021, this downtick in the UAH record began in January 2020 — a year and 4 plus months ago — and reflects a decline in lower troposphere temperatures of some 0.65 deg C, which is almost 1.2 deg F.
In other words, well more than half of the seemingly scary increase in temperature since 1901 shown in the EPA graph has just gone away in the last 16 months. So the Biden EPA, not wanting to complicate the official story of “climate change is happening now,” simply truncated the data in its graph at January 2020 to shut out the last year plus of big temperature declines. There is no way to characterize the EPA graph as other than intentionally deceptive.
I guess it’s OK because it’s in the noble cause of convincing the American people to allow the government to spend a few trillion dollars on windmills and electric car charging stations for the rich.
Communism solves invented crisis, but replaces it with real crisis of poverty and slavery.
The EPA (really the Democratic Party) is jut another criminal enterprise. They know it, we know it, everyone knows it.
It may not be possible to fumigate the Federal government to the extent necessary so that rational, decent people will once again have confidence and trust in it.
Yep. It’s changing into summertime.
No one can prove that any temperature change up is the result of human generated CO2.
No one has a mechanism for eliminating CO2 back to some ideal norm or what that norm is.
We know that temperatures have changed drastically from what they are now without humans existing.
We know that if the temperature drops far enough we get cold and ice and that’s a bad thing.
So I’m going out on my old motorcycle and generate some CO2 and forget all this.

It’s May 15. 8AM.
I’m wearing a jacket.
Mid may??? A jacket??? I’m usually through with long sleeves by the end of April. And I get cold easy.
The past 8 years we have seen some of he most harsh winters I’ve seen in my life. Cold temperature records of 100 years and more broken all over the country, 100 year snowfall records broken. People have mentioned riht here on FR that they have seen first cold spells earlier than normal and last frost later than normal for at least the past 2 years, maybe more.
I looked up our local temperature records since 1906 I think, here in east Texas. The hottest temps of my lifetime was the last day of July and first couple of days of August 1998. It was 106 to 108 for 3 days in a row. Normal hottest day of the year was 104 usually, with a 105 thrown in every few years. To find 108 again you had to go back to the 1930s. I remember those 108 days, I was amazed, I had never seen anything above 105 that I remembered.
Nowthe past 8 years I’m seeing themost harshwinters I’ve ever seen. Winter of 2013 into 14 we got 3 inches of snowthat stayed ont he ground for a week. Never dreamed I’d see that, we usually get maybe an inch of snow once every 4 or 5 years, it’s mostly gone by sundown, a few small patches here and there the next day where it was in shade all day.
This past winter we got the coldest temps in 120 years. Down to 11 one morning, 2 the next. It’s unusual to see anything below 16 around here. Not a lot of snow, maybe an inch, but ice stayed on the ground for over a week. Also unusual.
None of this sounds like global warming to me. I’m thinking Dr John Casey is a lot closer to the truth than internet inventor Al Gore will ever be. We’re headed into a new solar minimum, we’re looking at 30 to 50 years of similar winters, and worse. I’ll be looking for a goose down coat, wore my last one out...
EPA needs to merge with BLM.
They could be renamed: BLEPAM.
(Translation: f*&^ the plebes—we can lie all we want about unemployment and “climate change”.)
The climate has changed, is changing, and will continue to change.
As Rush asked many times....what is the correct temperature of the planet? No scientist can answer that.
“Yep. It’s changing into summertime.”
******************************************
It’s been darn chilly in my part of Maryland. My cicada buddies (at least some of them) finally are getting impatient and tired of waiting for the ground temperature to reach 64 degrees and decided to begin to slowly emerge. Looks like toward the end of next week we’ll reach their desired ground temperature and the actual mass emergence will begin.
Where’s global warming and summer when you need it?
Climate change has constantly happened since God set the whole thing spinning and will continue to do so. Nothing we can do will affect it.
Nobody is going to change the actual temperatures (except maybe nutcase Bill Gates with his sun blocking satellite trash idea). But what "they" can do is change the temperature data like they did here:
In 1999, the historical temperature data looked like this:

In 2019, the same temperature data looked like this:

Because the actual temperature data does NOT support their CO2/Global Warming/Climate Change insanity, the scum at NOAA and DNC changed the data! Notice how the 1930's got cooler in the 2019 graph as compared to the 1999 graph. WE can't have the temperature data be consistent w/GRAPES OF WRATH, can we? Low CO2 and record high US tempertures MUST BE ALTERED or else even the dumbest of the dumb will see that they are being lied to.
You can't make this stuff up. Info from Tony Heller at REALCLIMATESCIENCE.COM
Disclaimer: Opinions posted on Free Republic are those of the individual posters and do not necessarily represent the opinion of Free Republic or its management. All materials posted herein are protected by copyright law and the exemption for fair use of copyrighted works.