Skip to comments.
Big Data Can Lie: Simpson’s Paradox
Mind Matters ^
| April 15, 2019
| Robert J. Marks
Posted on 04/17/2019 11:40:49 AM PDT by Heartlander
Big Data Can Lie: Simpson’s Paradox
Simpson’s Paradox illustrates the importance of human interpretation of the results of data mining.
There are many ways data analytics can lead to wrong conclusions. Sometimes a dishonest data cruncher interprets data to further her agenda. But misleading data can also come from curious flukes of statistics. Simpson’s Paradox1, 2 is one of these flukes.
Here’s an example. Baseball player Babe has a better batting average3 than Mickey in both April and May. So, in terms of batting average, Babe is a better baseball player than Mickey. Right?
No.
It turns out that Mickey’s combined batting average for April and May can be higher than Babe’s. In fact, Babe can have a better batting average than Mickey every month of the baseball season and Mickey may still be a better hitter. How? That’s Simpson’s Paradox.
Here are the data for the two consecutive months:
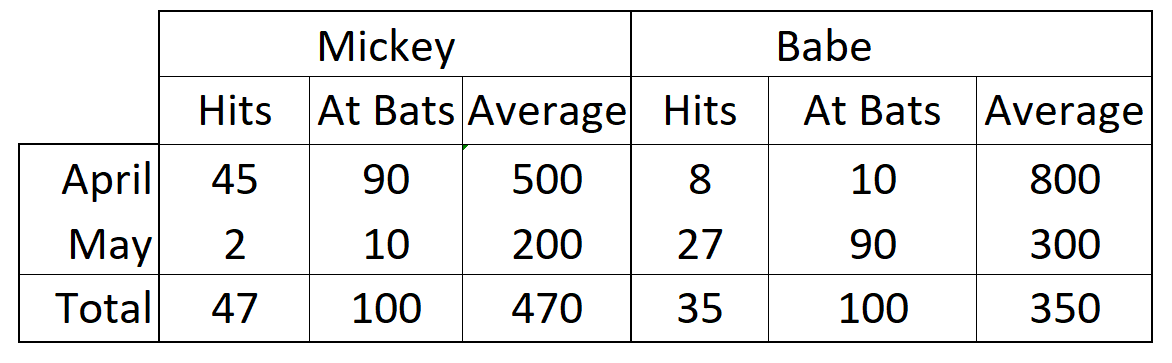 For both the months of April and May, both Mickey and Babe had 100 at bats. For April, Mickey’s stat was 45 hits out of 90 at bats and Babe’s was 8 out of 10. The batting averages (per cent times 1000) was 500 for Mickey and 800 for Babe. Babe’s batting average was much higher for April. The same is true for May. Babe’s 27 hits for 90 at bats gives her a batting average of 300 while Mickey’s average, 2 out of 10, gives him an a lower average of 200. But the aggregate data tell a different story. Mickey’s total of 47 hits gives him an average of 470 while Babe’s batting average of 350 comes from only 35 hits.
Simpson’s Paradox illustrates the importance of human interpretation of the results of data mining. Nobel Laureate Ronald Coase said, “If you torture the data long enough, it will confess.” Unsupervised Big Data can torture numbers inadvertently because aritifical intelligence is ignorant of the significance of the data.
What’s Going On?
Data viewed in the aggregate can suggest very different properties than the same data, examined in more detail, would. A more general view of Simpson’s Paradox is evident in the following animated gif 4 where experimental results of two variables are plotted.
What is the overall trend if a line is fit to this data? If all the data is used, the trend line is decreasing. If five individual data clusters are identified and lines fit, we have, for each group of points, an increasing trend. The conclusions are opposites. Without knowing which points belong to which class, there is no right answer.
Clustering remains largely an art
An underlying cause of the challenge posed by Simpson’s Paradox is clustering, where individual data points in a big data set must be grouped into distinct groups (or clusters). Clustering is a heuristic, a practical method of problem-solving that remains largely an art. In the above figure, for example, do we keep all the data in one big cluster, divide it into two groups, or five groups, or ten? If we know nothing more about the data, there is no right answer. For this particular case, we might eyeball that there are five clusters of points in the figure. But in other cases, the points are more homogeneously distributed and it will not be as clear.
Even more challenging is characterizing data that represent 25 different variables instead of only two. Directly visualizing points in a 25-dimensional space is simply not possible for a human. A seasoned practitioner with domain expertise must spend some time becoming friends with the data before figuring which data point goes where. A human is needed to make things work.
Do we really need a human to identify the clusters? Backer and Jain 5 note
…in cluster analysis a group of objects is split up into a number of more or less homogeneous subgroups on the basis of an often subjectively chosen measure of similarity (i.e., chosen subjectively based on its ability to create “interesting” clusters)
Note the repeated use of the term “subjectively,” meaning a decision based on the judgment of a human. The criterion is that the clusters be “interesting.”
There is no universally agreed upon categorical definition of a cluster in mathematics.6 Which clustering procedure or clustering procedure class is used is a human decision.
Big Data Is Ignorant of Meaning
Simpson’s Paradox illustrates the need for seasoned human experts in the loop to examine and query the results from Big Data. Could AI be written to perform this operation? Those who say yes are appealing to an algorithm-of-the-gaps. They say it can’t be done now, but maybe they’ll develop computer code to do it someday. Don’t hold your breath.
TOPICS: Education; Reference; Science; Society
KEYWORDS: datamining
Navigation: use the links below to view more comments.
first previous 1-20, 21 last
To: Heartlander
Why didn’t he continue with the baseball references? You can outscore the other team 50-7 over a five-game series. But you still lose the series if it goes like this:
- 1-0
- 0-30
- 0-17
- 4-2
- 2-1
Navigation: use the links below to view more comments.
first previous 1-20, 21 last
Disclaimer:
Opinions posted on Free Republic are those of the individual
posters and do not necessarily represent the opinion of Free Republic or its
management. All materials posted herein are protected by copyright law and the
exemption for fair use of copyrighted works.
FreeRepublic.com is powered by software copyright 2000-2008 John Robinson