Posted on 09/08/2017 10:30:26 AM PDT by ransomnote
I've come across a collection of videos showing epic flood footage taken from all over the world. Of the 5 I watched, some contain portions of footage from other videos (duplicate) but most is unique. The floods are of jaw dropping proportion and are taken from Spain, Italy, Turkey, India, China, New Zealand etc. It's hard to fathom how this flooding has been taken place on such an epic scale but I've not seen the footage anywhere else. Even in my state, there was apparently a "historic" flood a few months ago that I never saw on TV.
The footage is put forth by a pair of pastors. The linked clip contains flood footage in the first 8 minutes which is then followed by topics relevant to their religious ministry. I will post another link below in which I list the portions of the videos that contain flood footage, as opposed to discussion of their purposes in producing the videos. As I said, they have several of these videos - the one from China was jaw dropping.
Floods https://www.youtube.com/watch?v=nnosXq9gyFg&t=622s
Timing marks for flood footage: From 1:00 to 2:15 mark From 3:22 to 4:15 mark From 5:33 to 6:07 mark (features softball sized hail in India) From 7:13 to 7:43 mark (flooding in Turkey, Tunisia and Aman must be seen to be appreciated!)
Lots of hype. Some because there are more people around so we notice things more. Also the media has made a cottage industry of sowing fear.
Personally, I don't see big changes, nothing unusual, etc. But I am only 57.
Asia seems to have Harvey-like floods somewhere almost every year.
And just think, water - like the elements is the same amount of water that was here millions of years ago. It changes form solid liquid gas and (lest we forget) plasma but it’s the same amount that ever was.
My property is about 515 feet above sea level. When the well was drilled years ago, the drillers expected to find and did find sea shells at about 200 feet below ground, which would be 300 feet above sea level.
The earth is such a mysterious place. At least it is to some people.
Have we had anything recently that compares to the New Madrid Earthquake, the Johnstown Flood, or Krakatoa?
People are pretending that somehow our natural disasters today are worse than ever, when in fact, it’s not even close.
Would you count a few snowflakes falling in the DC area each year? /s
Part of today’s flooding is just human proximity and manipulation of water’s natural habits. Cities are gigantic impermeable surfaces with their roofs and pavement, creating high-intensity water flow routes. Then we divert and dam waterways, causing it to intensify.
Southern China has experienced very serious flooding this past summer because of multiple tropical storms going through the region—even Hong Kong was affected.
There is always flooding, many major, somewhere in the world, all the time.
To those saying that it’s normal flooding - it isn’t. Scientific American notes the extreme weather and suggests it may be the “new normal.” Note the word, “new.”
“Over the past year alone, catastrophic rain events characterized as once-in-500-year or even once-in-1,000-year events have flooded West Virginia, Texas, Oklahoma, South Carolina and now Louisiana, sweeping in billions of dollars of property damage and deaths along with the high waters.”
https://www.scientificamerican.com/article/extreme-floods-may-be-the-new-normal/
Note the Scientific American article is dated August of 2016. Alot more has happened since then.
I know there are floods elsewhere. But try typing in “extreme flooding” in search engines and you get hits all over the world.
Here’s a few:
From late August 2017
VIDEO AT LINK (shows picture of massive gilded spire from building bobbing up in water like a cork)
http://www.cnn.com/videos/world/2017/07/25/extreme-flooding-asia-mxb-lon-orig.cnn
VIDEO From California in Oroville,Fresno and Sacramento; Colorado, Wyoming, Idaho, Washington:
(note that it shows a big rig as it is being blown over onto a cop car)
https://www.nbcnews.com/nightly-news/video/northern-california-struggles-with-extreme-flooding-after-week-of-rain-874778179975
Note that this isn’t hype - many times in my review of the info I came across comments about “Gee, it’s odd to have so many 1000 or 500 year storms back to back.”
And another re Asia:
“According to the United Nations, at least 41 million people in Bangladesh, India and Nepal have been directly affected by flooding and landslides resulting from the monsoon rains, which usually begin in June and last until September.”
http://www.iflscience.com/environment/heavy-monsoon-causing-extreme-flooding-in-south-asia-has-killed-1200-people-so-far/
“Currently India, Nepal, and Bangladesh are being hit by the most extreme floods seen in the region for more than a decade. The huge amount of water being dumped on the region has exacted a deadly toll, with 1,200 people known to have died so far, while over 40 million have been displaced.”
http://www.iflscience.com/environment/heavy-monsoon-causing-extreme-flooding-in-south-asia-has-killed-1200-people-so-far/
PSA: “Just 6 inches of fast-moving flood water can knock you over and possibly carry away your car, according to AAA. If your vehicle does become flooded, leave the car to get to higher and safer ground, prioritizing your personal safety over the fate of your car, AAA says.”
https://www.nbcnews.com/nightly-news/video/northern-california-struggles-with-extreme-flooding-after-week-of-rain-874778179975 (same as video link above)
Scientific American + the Google Search Engine
A group of scientists have done a statistical analysis of the use of the Google Search engine on subjects like “climate change” and “extreme weather”. There is a statistical aberration in Google’s search results - what is making it to the top of the search results, that is only possible with a political bias, and low and behold, such use of a bias in written right into Google search managers guide book.
Scientific American has not been a top reputable science journal since at least the 1980s, when I quit subscribing.
The mere mention of the words “extreme” or “record” in terms of either flooding or temperatures does not make it so, without the data, and there it also depends on whether raw data is used or “adjusted” data.
And records from when? Often when looking at “from when” a particular record has been reliably known to have been kept is but a brief bit of all human history. And what are real earth weather and climate cycles in; periods of a century or so?; no, thousands of years.
At lot of references to “normal” is only so far as a particular record has been kept; which in most cases, as I said is but a brief period in time.
In general, how long has the earth been warming and the seas generally rising? SINCE THE END OF THE LAST ICE AGE.
Even then, we are not likely as warm yet as during the age when Greenland was farmed by the Vikings; and how in the hell did that happen with CO2 that was much lower??
“Currently India, Nepal, and Bangladesh are being hit by the most extreme floods seen in the region for more than a decade. “
For more than a decade merely means at least a decade ago they had such flooding; and likely before that, and sometime before that; and sometime before that; ext., ect., ect.
“Build your house upon the rock.” (Matthew 7:24)
Are there more than 5000 places which can flood? You tell me. Of such places, for how many do we have accurate records for rainfall and flooding going back significant multiples of 500 years such that we can even determine what constitutes a 500-year event?
I will have to go watch Al Gores inconvenient video in order to determine whether we should expect floods or droughts. I do know that the number of hurricanes in the U.S. during the last ten or fifteen years is dramatically lower than predicted.
Locally we just had a heat wave. (It is summer afterall.) I read that we had the hottest day in 90 years. How am I supposed to be impressed with global warming when I read that the weather was just as hot 90 years ago as today?
I hear a lot about the problems with ice loss in Antarctica recently. What happened to the Arctic that I don't hear predictions lately that it will become ice free year round?
I could do better predicting climate change by rolling dice. Every time the dice turn up snake-eyes, I will predict climate catastrophe. If anything else turns up, I will simply wait until the next roll. One clue that we are being played is that the con-artists are cooking the books and faking the data. If a global catastrophe was really upon us that would not be necessary.
The 1000 and 500 year floods actually refer to probability of it occurring, not years between occurrences. So the first half of 2016 had three of these, and then you look at the probability of three events, each with 1/1000 probability of occurring, would all occur that close together. Therefore been more since then. There have been 9 one-thousand year (1/1000 probability) from 2010 to 2015 and there have been more since then. Because such extremes are becoming more common, scientists are looking at finding another name for them (probability is increasing).
There were 5-thousand-year-floods during the first 9 months of 2016 in the US; statistically this would be considered rare.
https://www.edf.org/blog/2016/09/01/we-just-had-five-1000-year-floods-less-year-whats-going
There were 10 such events in the US from 2010 to 2015 and more since then; again, statistically this is unusual. Because of the increase, scientists are suggesting that they’ll have to pick another name for this kind of extreme precipitation because they are now happening more often. I’m surprised that the increase in catastrophic flooding is debated here. Are we not still under water in Houston, watching Irma and Jose approach?
I believe some on this thread are fully insulated against this issue by denying all printable forms of data I might supply as “Lies and damned lies.” For those who may have genuine interest....
“As Harvey’s rains unfolded, the intensity and scope of the disaster were so enormous that weather forecasters, first responders, the victims, everyone really, couldn’t believe their eyes. Now the data are bearing out what everyone suspected: This flood event is on an entirely different scale than what we’ve seen before in the United States.”
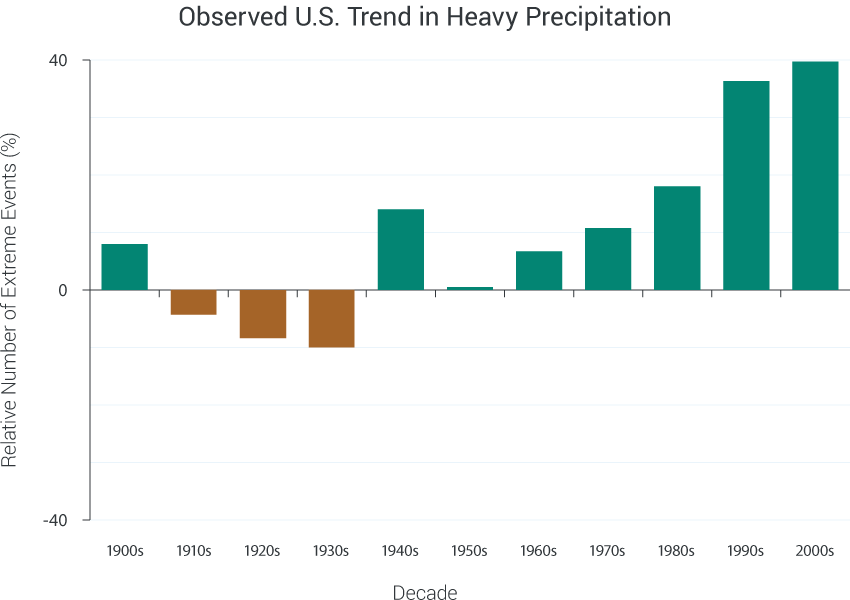
Heavy downpours are increasing nationally, especially over the last three to five decades, with the largest increases in the Midwest and Northeast. Increases in extreme precipitation are projected for all U.S. regions.
The report points to an alarming trend of flood disasters affecting ever wider areas, while at the same time becoming more severe.
Nice graphic here demonstrating trend - I’ll have to put it in a following post because it’s just not behaving right.
http://nca2014.globalchange.gov/sites/report/files/images/web-large/CS_extreme-precip-index_13263_V9_0.png
http://nca2014.globalchange.gov/report/our-changing-climate/heavy-downpours-increasing
“The massive rainfall that caused a devastating flash flood in Ellicott City, Md., last weekend was a rare 1-in-1,000-year event that has been happening with unprecedented frequency in recent years, meteorologists said. SNIP One nearby spot recorded 8.22 inches, amounts that weather service meteorologist Greg Carbin called “off the charts.”
So many “1-in-1,000 year” rainfalls appear unprecedented. “The number of these type of events has seemingly become more pronounced in recent years,” meteorologist Steve Bowen of a global reinsurance firm Aon Benfield said in a tweet Monday.”
“Heavy rain events have increased by 71% in the northeastern U.S. (including Maryland) between 1958 and 2012, according to the National Climate Assessment.”
https://www.usatoday.com/story/weather/2016/08/01/ellicott-city-maryland-flood/87914944/
“In fact, observations over the last 60 years indicate that over the United States, the amount of water falling in heavy rain events has increased substantially, and an astonishing 71 percent over portions of the mid-Atlantic and northeastern U.S.
In other words, if there were two storms with an identical structure over Boston, Massachusetts – one in 1955 and one in 2016 – the one in 2016 would, on average, produce 71 percent more rainfall.
So many “1-in-1,000 year” rainfalls appear unprecedented. “The number of these type of events has seemingly become more pronounced in recent years,” meteorologist Steve Bowen of a global reinsurance firm Aon Benfield said in a tweet Monday.
The map shows percent increases in the amount of precipitation falling in very heavy events (defined as the heaviest 1% of all daily events) from 1958 to 2012 for each region of the continental United States.”
http://nca2014.globalchange.gov/report/our-changing-climate/heavy-downpours-increasing#graphic-16693
Shall I assume that all the scientific references used to produce that last report are biased? Is everything outside individual opinion suspect?
1. Balling, Jr., R. C., and G. B. Goodrich, 2011: Spatial analysis of variations in precipitation intensity in the USA. Theoretical and Applied Climatology, 104, 415-421, doi:10.1007/s00704-010-0353-0. | Detail ↩
2. Dai, A., 2006: Recent climatology, variability, and trends in global surface humidity. Journal of Climate, 19, 3589-3606, doi:10.1175/JCLI3816.1. URL | Detail ↩
3. Dai, A., 2012: Increasing drought under global warming in observations and models. Nature Climate Change, 3, 52-58, doi:10.1038/nclimate1633. URL | Detail ↩
4. Karl, T. R., J. T. Melillo, and T. C. Peterson, 2009: Global Climate Change Impacts in the United States. T.R. Karl, J.T. Melillo, and T.C. Peterson, Eds. Cambridge University Press, 189 pp. URL | Detail ↩
5. Kunkel, K. E., L. E. Stevens, S. E. Stevens, L. Sun, E. Janssen, D. Wuebbles, and J. G. Dobson, 2013: Regional Climate Trends and Scenarios for the U.S. National Climate Assessment: Part 9. Climate of the Contiguous United States. NOAA Technical Report NESDIS 142-9. 85 pp., National Oceanic and Atmospheric Administration, National Environmental Satellite, Data, and Information Service, Washington, D.C. URL | Detail ↩
6. Kunkel, K. E. et al., 2013: Monitoring and understanding trends in extreme storms: State of knowledge. Bulletin of the American Meteorological Society, 94, doi:10.1175/BAMS-D-11-00262.1. URL | Detail ↩
7. Peterson, T. C. et al., 2013: Monitoring and understanding changes in heat waves, cold waves, floods and droughts in the United States: State of knowledge. Bulletin of the American Meteorological Society, 94, 821-834, doi:10.1175/BAMS-D-12-00066.1. URL | Detail ↩
8. Santer, B. D., C. Mears, F. J. Wentz, K. E. Taylor, P. J. Gleckler, T. M. L. Wigley, T. P. Barnett, J. S. Boyle, W. Brüggemann, N. P. Gillett, S. A. Klein, G. A. Meehl, T. Nozawa, D. W. Pierce, P. A. Stott, W. M. Washington, and M. F. Wehner, 2007: Identification of human-induced changes in atmospheric moisture content. Proceedings of the National Academy of Sciences, 104, 15248-15253, doi:10.1073/pnas.0702872104. URL | Detail ↩
9. Simmons, A. J., K. M. Willett, P. D. Jones, P. W. Thorne, and D. P. Dee, 2010: Low-frequency variations in surface atmospheric humidity, temperature, and precipitation: Inferences from reanalyses and monthly gridded observational data sets. Journal of Geophysical Research, 115, 1-21, doi:10.1029/2009JD012442. | Detail↩
10. Vose, R. S. et al., 2013: Monitoring and understanding changes in extremes: Extratropical storms, winds, and waves. Bulletin of the American Meteorological Society, in press, doi:10.1175/BAMS-D-12-00162.1. URL | Detail ↩
11. Wang, M., and J. E. Overland, 2009: A sea ice free summer Arctic within 30 years?Geophysical Research Letters, 36, L07502, doi:10.1029/2009GL037820. URL | Detail↩
12. Wehner, M. F., 2013: Very extreme seasonal precipitation in the NARCCAP ensemble: Model performance and projections. Climate Dynamics, 40, 59-80, doi:10.1007/s00382-012-1393-1. | Detail ↩
13. Willett, K. M., P. D. Jones, N. P. Gillett, and P. W. Thorne, 2008: Recent changes in surface humidity: Development of the HadCRUH dataset. Journal of Climate, 21, 5364-5383, doi:10.1175/2008JCLI2274.1. | Detail ↩
14. Wuebbles, D. J., G. Meehl, K. Hayhoe, T. R. Karl, K. Kunkel, B. Santer, M. Wehner, B. Colle, E. M. Fischer, R. Fu, A. Goodman, E. Janssen, H. Lee, W. Li, L. N. Long, S. Olsen, A. J. Sheffield, and L. Sun, 2013: CMIP5 climate model analyses: Climate extremes in the United States. Bulletin of the American Meteorological Society, in press, doi:10.1175/BAMS-D-12-00172.1.
Hey! I just got a backhanded attempt at intimidation sent as an FR “private message”! I find those irresistable! Let’s see if rainfall really is a verbotten subject here at FR!
______________________________
Here’s the text of the message:
“Have you taken over Catastrophism which was managed by Sunken Civ until he was forced out? If you do have a ping list for earthquakes, volcanoes, meteor strikes, etc. I would like to be on it. Thanks.”
______________________________
For the record, receiving that message inspired me to include that long list of references AND slog through some HTML hassle that would have otherwise not been worth it! :)
EDF - nuff said - agenda, not science
NOAA - “adjusted” data - again, agendas at work
Refs from the above: - a circular path of “scientists” references each other
So YOU really are the only reliable source of data? Got it!
Disclaimer: Opinions posted on Free Republic are those of the individual posters and do not necessarily represent the opinion of Free Republic or its management. All materials posted herein are protected by copyright law and the exemption for fair use of copyrighted works.