Doug Ashdown might be about to rewrite some old lyrics
Posted on 01/09/2013 12:54:37 PM PST by Ernest_at_the_Beach
Earth’s surface area is 510 million km2, but the State of the Climate report from the USA's National Climatic Data Center at the nation’s National Oceanic and Atmospheric Administration says the contiguous USA’s 7.664 million km2 experienced its hottest year ever recorded during 2012, which it also ranked the second most “extreme” for weather events.
The report, available here, is a dispassionate document that adumbrates plenty of data but doesn't offer deep links to more detailed information. Nor does the report contain the phrase “climate change”, any mention of anthropogenic emissions or carbon dioxide. What’s in the report? This opening paragraph sets the tone for the rest of its contents:
“In 2012, the contiguous United States (CONUS) average annual temperature of 55.3°F was 3.3°F above the 20th century average, and was the warmest year in the 1895-2012 period of record for the nation. The 2012 annual temperature was 1.0°F warmer than the previous record warm year of 1998. Since 1895, the CONUS has observed a long-term temperature increase of about 0.13°F per decade. Precipitation averaged across the CONUS in 2012 was 26.57 inches, which is 2.57 inches below the 20th century average. Precipitation totals in 2012 ranked as the 15th driest year on record. Over the 118-year period of record, precipitation across the CONUS has increased at a rate of about 0.16 inch per decade.”
The report also notes dozens of all time temperature records (albeit from as-yet-incomplete data) at diverse locations across the nation and found an extra 26 million people who experienced at least ten 100°F days during the year.
Above-average cyclone activity was detected, drought covered more of the country to reach levels last seen in the 1950s and wildfires burned an above-average amount of ground.
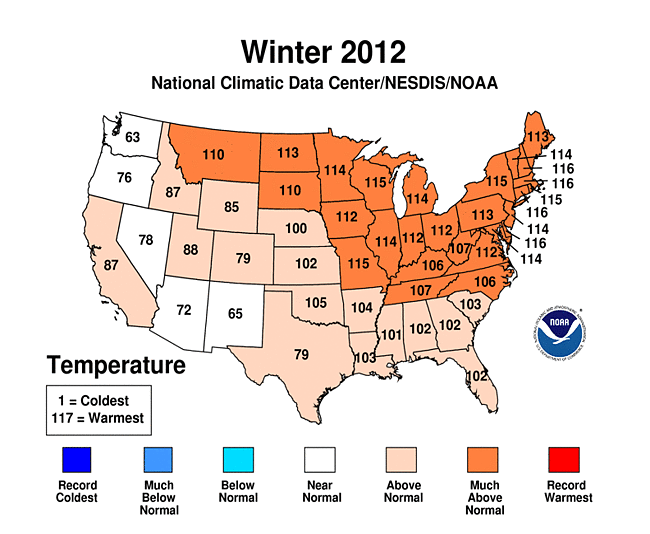
Winter was the fourth-warmest on record and produced the third-smallest snow cover observed since humans started to write this kind of stuff.

Doug Ashdown might be about to rewrite some old lyrics
The summary of the report therefore offers the following analysis of the U.S. Climate Extremes Index:
“The index, which evaluates extremes in temperature and precipitation, as well as landfalling tropical cyclones, was nearly twice the average value and second only to 1998. To date, 2012 has seen 11 disasters that have reached the $1 billion threshold in losses, to include Sandy, Isaac, and tornado outbreaks experienced in the Great Plains, Texas and Southeast/Ohio Valley.”
The report also found that October 2012 broke a 16-month streak in which each successive month reported higher-than-average temperatures. Four “all-time record low minimum temperatures” are also noted as setting new lows or equalling old marks across the nation. Tornado activity fell to levels not seen since 2002.
The report is silent on why 2012 produced the weather it records. The few mentions of large-scale climate phenomena such as the Gulf Stream or El El Niño/La Niña dispassionately report observations about them during 2012 and refer to their potential influence on US weather, but don’t go any further.
One data point that may raise eyebrows is the size of the storm surge created by post-tropical storm Sandy. The relevance of that singular data point in the context of a nationwide report is not explained.
We’re sure others will find motivation to do so elsewhere, or in the comments. ®
Related thread:
Does NOAA’s National Climatic Data Center (NCDC) keep two separate sets of climate books ...
fyi
Woo-Hoo!
LOL.
If a point of focus is arranged, and discussion of that arranged focus ensues, there will be discussion.
Few are concerned about the motives of the discussion of the focus as the focus exists as a truth to discuss. It’s there, and it’s being discussed.
If the focus is removed.......
It’s sort of like the guy standing on the corner looking up at the sky, and of a sudden there are three, or more looking up at the sky around him. Then there are more, and more. Soon people depart towards their previous destinations as nothing is there for them to see none the wiser they’ve been played for fools.
Hansen probably spends an inordinate amount of time at gambling casinos.
They haven’t even adjusted the 1998 data yet.
More of Hansen’s work?
This tells me that NOAA has been gradually infiltrated with Warmest environmentalists who have an agenda to carry out. 2 years ago when world temperatures were among the coldest ever recorded, the very same organizations were saying that the temperature fluctuations are no refutation of global warming. But now a few years later we have record warm temperatures and here they come to tell us that temperatures have everything to do with global warming. So, by their logic, if temperatures rise, that’s global warming/climate change. But if temperatures fall and produce the coldest winters on record -—well that’s global warming/climate change too.
So what if this is true? Records have been kept a very short period of time and even if true for the US, there were other areas that are suffering from extreme cold. It’s all cyclical.
And December 2012 just had the greatest snow coverage for any December in the past 45 years in the Northern Hemisphere.
Of course I don’t believe it——comes from the government right? That’s all that needs be said.
Carbon tax here we come. Gotta find a way to hit them middle class tax paying folks with some taxes, after all.
New Motto: NO TAXPAYER LEFT BEHIND.
Disclaimer: Opinions posted on Free Republic are those of the individual posters and do not necessarily represent the opinion of Free Republic or its management. All materials posted herein are protected by copyright law and the exemption for fair use of copyrighted works.