
Norseman arriving in Iceland
Posted on 10/16/2010 7:56:43 AM PDT by Ernest_at_the_Beach
I know the Hockey Stick is old news to most blog readers here, but it’s easy to forget that the people reading the mainstream news (ie: most of the West) have no idea of the scale of the audacity involved. Up until the 1998 MBH paper came out, it was widely understood that there was a Medieval Warm Period, indeed there were hundreds of papers available at the time. The Hockey Stick Graph completely rewrote everything, yet was accepted and widely promoted without anyone so much as asking for the data… until, of course, McIntyre and McKitrick tried. It will do down in the annuals of science as one of the most egregious examples of “the not-so-scientific” method. — JoNova
The public might not understand the science, but they do understand cheating
Dr. David Evans
6 October 2010
[A series of articles reviewing the western climate establishment and the media. The first and second discussed air temperatures, the third discussed ocean temperatures, the fourth discussed past temperatures, the fifth compared the alleged cause (human CO2 emissions) with the alleged effect (temperatures).]
Norseman arriving in Iceland
Faced with the obvious disconnect between human CO2 emissions and temperature (Figures 21 and 22), the climate establishment either had to change its theory or change its data.
The establishment’s anti-scientific attitude that its theory triumphs over data was famously on display in the Climategate email where Kevin Trenberth, who believed (in 2008) that global warming was still occurring but was bemoaning that no one could find it using actual real-world measurements, said “The fact is that we can’t account for the lack of warming at the moment, and it is a travesty that we can’t.”
They chose not to change their theory, so they had to change their data (thereby disqualifying themselves as scientists). Because the CO2 figures come from historical consumption data that are very hard to dispute, they had to change the temperature data instead.
“We have to get rid of the Medieval Warm Period”
They needed to move the start of the global warming trend from before 1700 to a time when human emissions were becoming significant compared to today’s level—to say 1910, which is also at a minimum in the warming-cooling pattern (figures 20 and 22).
And to make the current warming unprecedented, they needed the current temperature to be greater than anything in the last thousand years. In a rare insight or slip, one of the leading establishment climate scientists sent University of Oklahoma geoscientist David Deming an email in 1995 that said “We have to get rid of the Medieval Warm Period”, according to a statement by Deming to a US Senate Committee.
By 2001 the climate establishment had radically changed its mind on what past temperatures were—it revised the past from Figures 18 and 19 to:
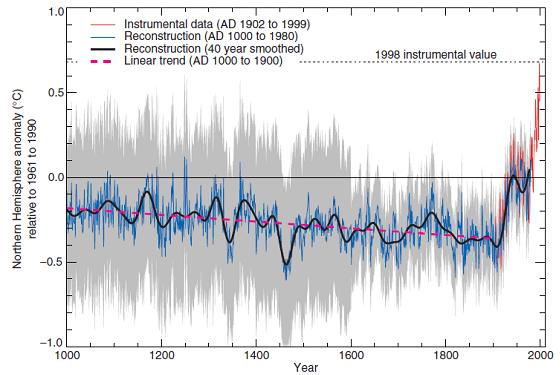 Figure 23: The hockey stick graph by Michael Mann in 1998, so called because it has a long handle and a short upward blade, like an ice hockey stick. For the northern hemisphere. From the IPCC Third Assessment Report, 2001, page 134.
...
Michael Mann’s hockey stick graph is the most prominent and persuasive graph in the global warming debate. Most people who believe that man is responsible for global warming believe some version of the hockey stick. It was very widely publicized, and was even adopted by the IPCC for its logo (but later dropped).
The hockey stick is widely discredited in scientific circles outside climate science (this has been done to death elsewhere, so we’ll just go big-picture here):
“ In general, we found [Mann’s methods] to be somewhat obscure and incomplete* and the criticisms [by their main critics] to be valid and compelling.
… It is important to note the isolation of the paleoclimate community; even though they rely heavily on statistical methods they do not seem to be interacting with the statistical community.
… Moreover, the work has been sufficiently politicized that this community can hardly reassess their public positions without losing credibility.
Overall, our committee believes that Mann’s assessments that the decade of the 1990s was the hottest decade of the millennium and that 1998 was the hottest year of the millennium cannot be supported by his analysis.”
The climate establishment persists with putting forward similar temperature pictures. There are other, minor hockey sticks, similar graphs produced by climate-establishment scientists. The next most prominent is by Briffa, who refused to divulge his tree ring data for nine years (real scientists share their data). When finally revealed, his data showed that his hockey stick was based just on 10 trees in the Yamal peninsula of northern Russia, and relied almost entirely on one freak tree for the blade of the hockey stick—perhaps that special tree found a source of manure and had a growth spurt?
For more on the hockey stick shenanigans, for the more forensically inclined, see the Wegman and North Reports for Newbies.
Mann still defends his hockey stick, but gets comprehensively rubbished.
Why don’t the media inform us of the problems with the hockey stick picture, to counteract the earlier wide publicity it received?
* Scientists say “incomplete” as a polite way of saying “rubbish” or something earthier.
****************************
My short sharp wrap of the Hockey Stick story, with maps of all the empirical studies demonstrating the global nature of the MWP, and some of the statistical tricks that captures the effrontery: Fraudulent hockey sticks and hidden data
The hot statisticians — McShane and Wyner 2010: Zombie Hockey stick dies again
The day the Briffa data was exposed as being based on one tree: Breaking news: Cherry Picking of Historic Proportions
The place with all the studies and the huge Medieval Warm Period Project (CO2Science.org)
– Jo Nova
Image attribution: By Oscar Wergeland (1844–1910) from Wikimedia Commons
I have a good friend who is a liberal and lives by what the New York Times says...she’s generally well informed and very active politically...she’s never heard of climategate. Doesn’t know that global warming has been debunked, and thinks I am crazy to doubt Al Gore.
Sad but true...and you can’t talk to her about this. I suspect there are still many like her.
Only a flunky flak would not ask questions given such data.How people call themselves scientists and not bureaucrats is the real question. Does holding a chart or graphic in ones hands entitle him to be categorized as 'scientist'? It certainly doesn't qualify one to be considered an 'engineer'.
The threshold of what qualifies as 'science' is way too low.
bttt
Top Physics Professor Resigns From Post, Denouncing Global Warming "Fraud"
Thanks Eenest for continuing to post this stuff and, as always, I will link the original page to my fb. Many Conservatives think this fight is won because of the science. It will not be won until the governments of this world back down from their GW positions.
They are still planning to tax us out of existance and into a New World Order.
Mel
Now, the more recent "tree ring" data. There were two major groups of tree rings. One came from trees that'd lived on top a tall hill or ridgeline along the Lena river in Siberia.
The samples had been taken several decades ago ~ for an entirely different purpose (like NO ONE would imagine you could determine actual temperature from a tree ring ~ maybe relative climate conditions, but not temperature)
Mann found a second, and more recent sample that had been taken of trees along the Lena river. He requested a set and included them in his analysis (if we can call it that).
Apparently unbeknownst to Mann at that time the second sample wasn't from the top of the hills ~ in fact, it was impossible to gather additional samples from those trees since the local climate had gotten much colder, deteriorated, and all the trees had died and been blown away into the nether regions of the Lena river estuary region.
The Russian sample takers cleverly went to the BOTTOM OF THE HILLS and took supplemental samples from trees that were still alive. Apparently for their purposes that was OK.
These projects are written up and available on the internet.
Well, anyway, ol'Doc Mann pawed through his samples of tree rings to get a stream of data to which he imputed temperatures.
Remember, it was colder up in the mountains where the first samples grew. It was warmer down in the valleys where the second samples grew.
He stuck his inferences from the two samples together and got a jump in temperature (just like you would get a jump in temperature comparing termometers at the bottom of Death Valley in summer with the top of Everest in winter).
He stuck them on the "current" end of his graph and voila, a hockeystick!
I think we are faced with a fork in the road. Either Dr. Mann is a bright guy with poor judgment or he's not a bright guy and engages in risky behavior.
So many choices; so little time.
Ping
Disclaimer: Opinions posted on Free Republic are those of the individual posters and do not necessarily represent the opinion of Free Republic or its management. All materials posted herein are protected by copyright law and the exemption for fair use of copyrighted works.
