Is it safe to assume, that the first chart looks good, until you see the second chart which indicates that inflation destroys was looks to be positivie in the first chart?
Posted on 03/21/2022 7:40:15 AM PDT by Browns Ultra Fan
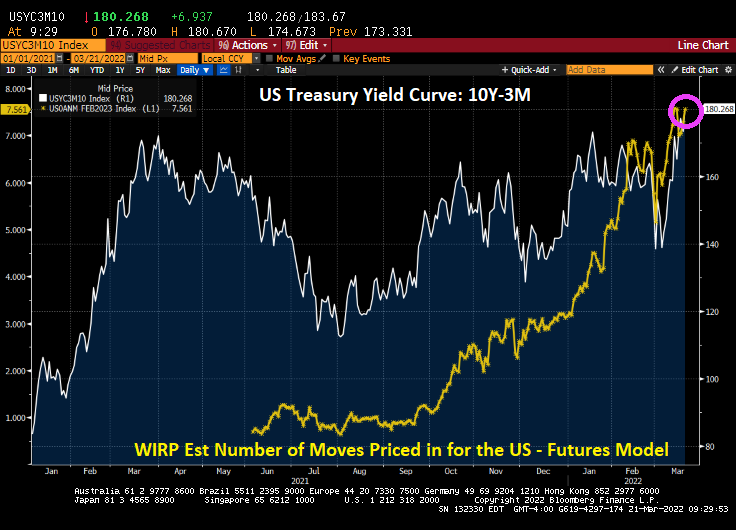
Oil prices are soaring as US President Biden pleads like a homeless person to foreign countries for oil rather than let the US produce more oil to drive down prices. Meanwhile, the US Treasury yield curve 10Y-3M is at its steepest (rising 10Y yields while The Fed keeps short rates at near zero).
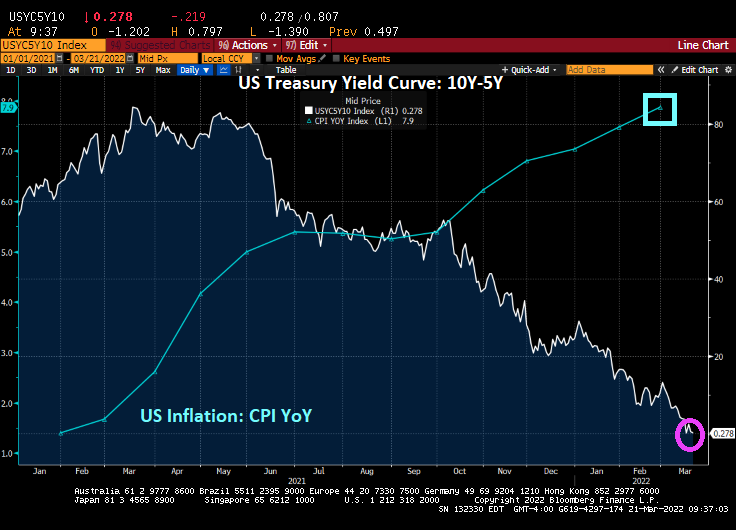
But if we look at the belly of the beast, so to speak, the 10Y-5Y slope, we can see that the Treasury curve has declined to a mere 0.278 basis points as inflation rages.
Bankrate’s 30-year mortgage rate keeps on climbing and has hit 4.55% as the 2-year Treasury yield rises rapidly.
The US Dollar Index has risen dramatically as US inflation has increased dramatically.
Oil? Oil is up over 4% in the US. Mexican Mix (not a #3 meal at Chuy’s) is up 7.32%.
Gasoline? NY prices are up over 10%.
Russian oil is up 9.35%.
Ah, for the good old days of 30 cents a gallon gasoline, although I always wondered about Gulf’s marketing campaign. “Good Gulf” seems to imply that the other Gulf gasolines aren’t good. And Gulf’s “No-nox” seems to imply that the other Gulf gasolines knock like Biden’s knees as he pleads for foreign oil.
(Excerpt) Read more at confoundedinterest.net ...
Higher gas ⛽ prices, higher food prices and war.
Thank a Democrat.
“...Don’t we get the same global warming if Venezuela sells us oil??...”
You are not supposed to be smart enough to ask that question
I’d like to see more information. Is this due to shortages, or is this due to a dying US dollar?
Is it safe to assume, that the first chart looks good, until you see the second chart which indicates that inflation destroys was looks to be positivie in the first chart?
Who sets the yields on that first chart?
10 year bond soaring. Now 2.25. Crazy out there. Gas out of sight. As I’ve said before, we need two pumps at every gas station. One for Democrats (Biden) and one for Republicans (Trump). Biden is killing working poor. And many middle class as well.
Oil at about $109.50.
I am admittedly ignorant as to what these charts mean, let alone know the answer to your quarsion. 🙂
Well having traded tons of treasuries...
Investors set those interest rates. Initially at the US Treasury auction and then in the secondary markets. Those investors (very savvy) decide what yield makes sense, taking future inflation into account along with other factors.
Thanks, I was about to answer, glad I looked down-page first. Good summary. Short-term Treasuries now beating liquid cash in banks for the first time in quite a while.
Qotd
Qotd
My point was bond traders are a savvy bunch and will take care of themselves. The FED just doesn’t say “here’s the rate, eat it”.
Yes, and that’s exactly right. Many people think the FED sets all interest rates but as you know they only set one, the overnight bank rate. That has some influence over the rest, mortgage rates are set off a markup from the 10yr Treasury rate every morning for example.
When I was selling real estate we used to wait for word every morning on the rate for the day for people who had contracts but were “floating” the rate, hadn’t locked it yet in hopes it would go down.
One night around 1995, the 10yr jumped from about 7% to 8% overnight, no warning. Blew up a lot of floaters.
“One night around 1995, the 10yr jumped from about 7% to 8% overnight, no warning”
Back then you only had the CBOT night session, closing at 8:30, no 24/7 trading like today.
So, you are confirming my assumptions? 🙂
You’d better say what they are first just so we are on the same page.
I thought it was obvious that I don’t really understand what is being presented, but I originally said, while the top graph looks to be positive, however, the bottom graph seems to destroy the top graph. Is that an accurate assumption?
Disclaimer: Opinions posted on Free Republic are those of the individual posters and do not necessarily represent the opinion of Free Republic or its management. All materials posted herein are protected by copyright law and the exemption for fair use of copyrighted works.