What an incredible dataset to look at.
Posted on 12/18/2024 6:09:03 PM PST by Tom Tetroxide
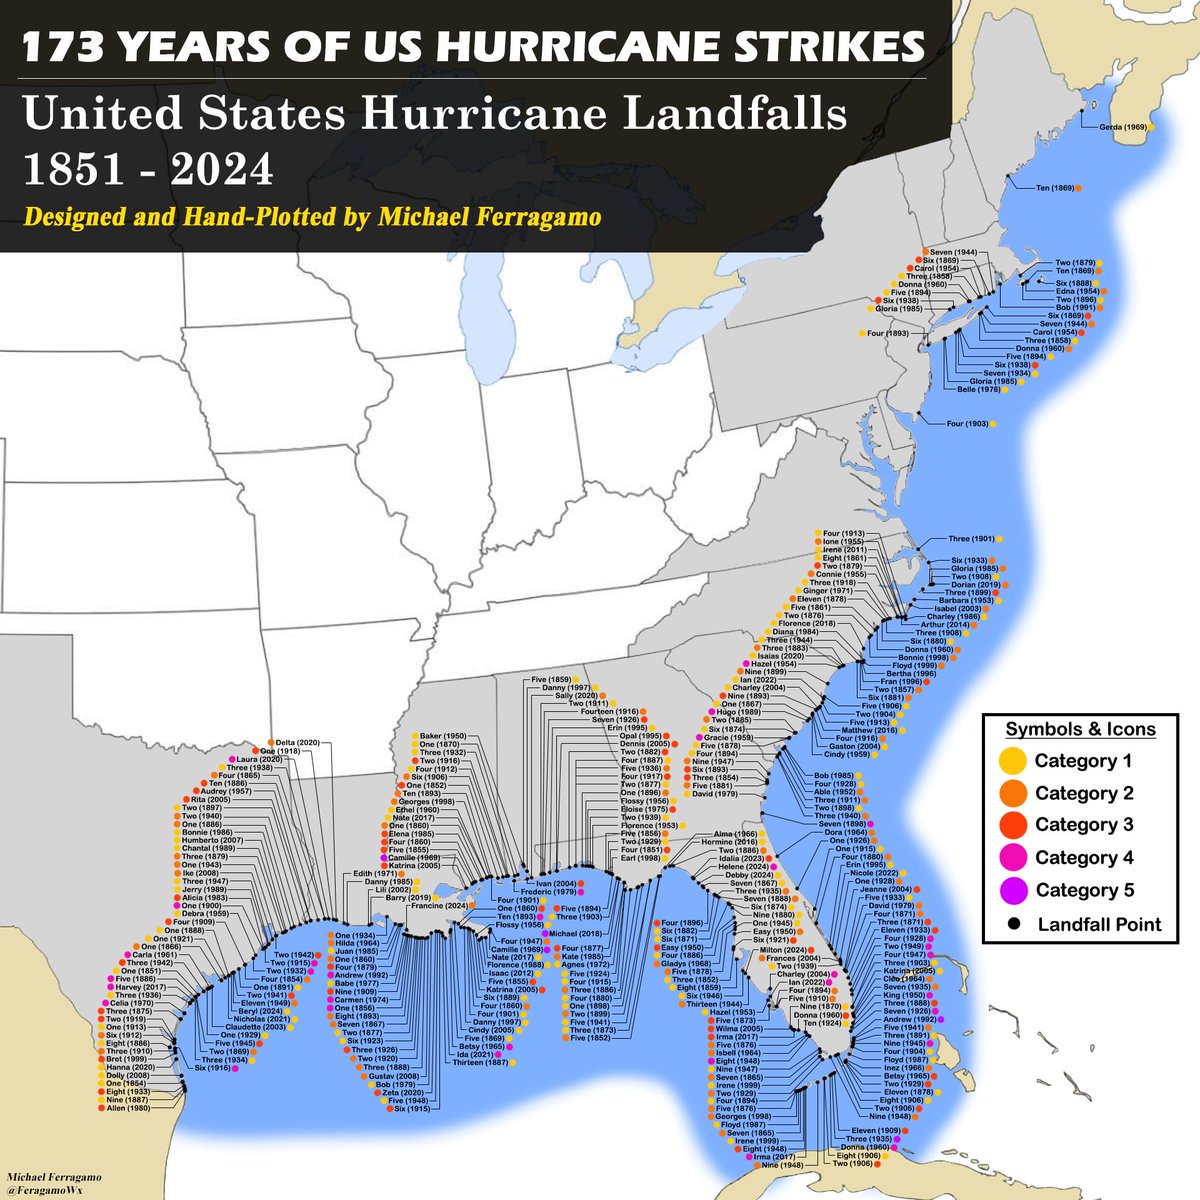
It's finally done. Over 3 days of hand-plotting 173 years' worth of data. The end result is unbelievable.
What an incredible dataset to look at.
“How does DelMarVa escape over the decades?”
There is still plenty of energy in those systems as they push through.
Don’t forget the Delaware Bay helping out too.
True.
Does it really matter if NOAA says it’s a Hurricane when your house is demolished?
“How do they all end at the border of Texas and Mexico?”
Orange Man Bad!
I thought this was supposed to be (another) awful year for hurricane strikes again.
While Helene and Milton were nothing to sneeze at, it seemed pretty quiet otherwise.
I wondered exactly the same! Found this:
Makes sense.
Nice job. It appears east central Florida has fared pretty well over time.
Good find.
Thank you.
Jekyll Island Rulz?
😂👍
WAY back in the day, a few friends and I spend a short week camping on the western side of Jekyll Island on a Spring Week vacation populated by Yankees.
Little did I know that I was involved in International Finance....
Thanks, I was wondering that. The presence of only a single strike between North Carolina and New York highlights just how unique Sandy was. Because of the distortion of projecting the US onto a flat surface, it’s hard to realize that there is a huge bight on the coast of Eastern U.S., where the shoreline turns north, away from the open seas, at the Southern tip of Virginia, and turns back out towards the open seas from New York to Nova Scotia.
There’s quite a few missing.
I think a lot has to do with the Gulf Stream current. It goes out to sea at Cape Hatteras and heads east. Historically, east coast hurricanes make an easterly turn. Just when that turn is made determines if and where there is a landfall.
I grew up on the coast of NC.
Thanks!
BKMK
1851-60: 17 1911-20: 21 1971-80: 15 1861-70: 17 1921-30: 17 1981-90: 18 1871-80: 20 1931-40: 24 1991-00: 15 1881-90: 20 1941-50: 31 2001-10: 23 1891-00: 28 1951-60: 35 2011-20: 19 1901-10: 23 1961-70: 17 2021-24: 12
1851-60: 17
1861-70: 17
1871-80: 20
1881-90: 20
1891-00: 28
1901-10: 23
1911-20: 21
1921-30: 17
1931-40: 24
1941-50: 31
1951-60: 35
1961-70: 17
1971-80: 15
1981-90: 18
1991-00: 15
2001-10: 23
2011-20: 19
2021-24: 12
It sure looks like the 10 year trend doesn’t follow the “Hurricanes are more frequent and more dangerous” narrative.
I fully expect them to stick with the “Hurricanes are causing more damage than ever before” narrative.
I did take on the project to see if this upward sloping curve I have always heard about made any sense. Like everything else it doesn’t. Grouping in ten-year segments seems to provide information, but any single year results are random.
I like it...nice job.
Disclaimer: Opinions posted on Free Republic are those of the individual posters and do not necessarily represent the opinion of Free Republic or its management. All materials posted herein are protected by copyright law and the exemption for fair use of copyrighted works.