Free Republic
Browse · Search
News/Activism
Topics · Post Article

Butt, butt, butt....
1 posted on 08/09/2023 11:25:26 AM PDT by rktman
[ Post Reply | Private Reply | View Replies ]


To: rktman
https://wattsupwiththat.com/2023/08/08/noaa-u-s-average-temperature-anomaly-data-through-july-2023-wheres-the-crisis/
2 posted on 08/09/2023 11:28:56 AM PDT by Yo-Yo (Is the /Sarc tag really necessary? Pray for President Biden: Psalm 109:8)
[ Post Reply | Private Reply | To 1 | View Replies ]

To: rktman
Curry was the unusual researcher who looked at criticism of her work and actually concluded "they had a point."...

Here's a point... 'Wildfires' do not start by themselves... Somebody lights the match and the media and authorities are for some odd reason failing to seek out those arsonist... I guess if you don't bother looking, then it makes the investigating part easier.

3 posted on 08/09/2023 11:33:35 AM PDT by jerod (Nazi's were essentially Socialist in Hugo Boss uniforms... Get over it!)
[ Post Reply | Private Reply | To 1 | View Replies ]

To: rktman

https://www.fraserinstitute.org/article/putting-the-con-in-consensus-not-only-is-there-no-97-per-cent-consensus-among-climate-scientists-many-misunderstand-core-issues

97%, my ass....


4 posted on 08/09/2023 11:37:00 AM PDT by nesnah (Infringe - act so as to limit or undermine [something]; encroach on)
[ Post Reply | Private Reply | To 1 | View Replies ]

To: rktman
Earth historical temperature, ice ages, warm periods, glacial periods and interglacial warm periods: We are in an interglacial warming period in an ice age period.

The first graph shows the long-term average global temperature view of warm periods and ice ages:

Note that Ice ages vary in length, but 50 million years is pretty typical. Warm periods last much longer than ice ages.

The second graph shows temperature variations for the last 450,000 years in our current Ice Age which started about 10 million years ago, depending on exactly where you want to specify the start temperature from graph 1. (The temperature scale on graph 2 is the average temperature at the Antarctica glacier bore site, not the same as the average global temperature from graph 1):

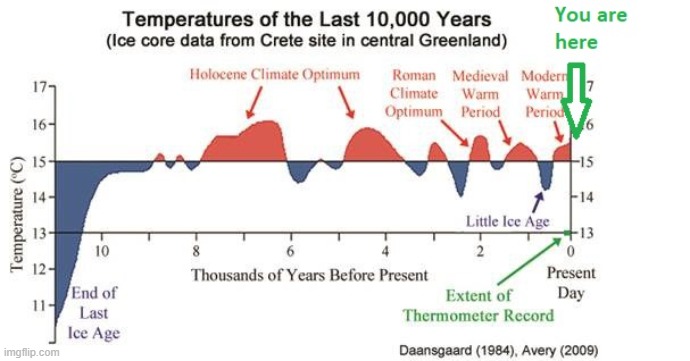
The temperature for the current interglacial warm period from ice core data in Greenland is shown in graph 3. Note that the temperature always fluctuates and that the current temperature is not out of the normal range of fluctuations:


5 posted on 08/09/2023 11:37:11 AM PDT by MtnClimber (For photos of Colorado scenery and wildlife, click on my screen name for my FR home page.)
[ Post Reply | Private Reply | To 1 | View Replies ]

To: rktman

They’ll scream and yell about this climate crisis but when you go outside you see no change so they’ll lock us in our homes ,LOL


8 posted on 08/09/2023 11:48:11 AM PDT by butlerweave
[ Post Reply | Private Reply | To 1 | View Replies ]

To: rktman

P


9 posted on 08/09/2023 11:49:19 AM PDT by SomeCallMeTim
[ Post Reply | Private Reply | To 1 | View Replies ]

To: rktman

Any level of fanaticism can be wrought from statistics. The devil is in the raw data ie: the percentage of cat 4-5 weather events doubled in the last decade. The actual number rose from 2% to 4% - an insignificant increase.


10 posted on 08/09/2023 11:59:39 AM PDT by ByteMercenary (Cho Bi Dung and KamalHo are not my leaders.)
[ Post Reply | Private Reply | To 1 | View Replies ]

To: rktman

There’s climate “consensus” among those who have paid positions as climate “scientists”. What a surprise! No conflict of interest there whatsoever!


11 posted on 08/09/2023 12:07:30 PM PDT by LuxAerterna
[ Post Reply | Private Reply | To 1 | View Replies ]

To: rktman

.


13 posted on 08/09/2023 4:24:36 PM PDT by sauropod (I will stand for truth even if I stand alone.)
[ Post Reply | Private Reply | To 1 | View Replies ]

Free Republic
Browse · Search
News/Activism
Topics · Post Article


FreeRepublic, LLC, PO BOX 9771, FRESNO, CA 93794
FreeRepublic.com is powered by software copyright 2000-2008 John Robinson