
Posted on 09/14/2020 3:32:42 PM PDT by DoughtyOne
PING LIST - Please contact me as needed...
COVID-19 Update # 180
As of 09/13/2020 23:15 PDST United States CDC - Provisional Numbers
As of 00/00/2020 23:45 PDST Johns Hopkins University - Capture Nations Informaton
As of 00/00/2020 23:45 PDST Johns Hopkins University - Capture Counties Information
As of 00/00/2020 23:46 PDST Johns Hopkins University - Process JHU Data
As of 00/00/2020 23:59 PDST WorldofMeters - Document Core Numbers
As of 00/00/2020 23:59 PDST WorldofMeters - Capture Nations Information
As of 00/00/2020 23:59 PDST WorldofMeters - Capture States Information
As of 00/00/2020 00:00 PDST WorldofMeters - Data Processing begins...
As of 00/00/2020 ??:?? PDST Publish COVID-19 Update - 00/00/00
Thank you for stopping by to check out the COVID-19 Update.
Here you can find...
Section: 01 Commentary, Special Reports, COVID-19 Update Info, & System Notes
Section: 02 the United States Situation
Section: 03 the Global Community Situation Outside China
Section: 04 the Global Community Situation Including China with reservations
Section: 05 the Mortality Report
Section: 06 Miscellaneous Reports of Interest
Section: 07 the United States, Counties (alphabetical / case no descending)
Section: 08 the United States, States Ranking, Provisional Numbers, & Territories
Section: 09 the United States, Ranked with Other Nations
Section: 10 the End of this COVID-19 Update
Section: 11 Data Sources and a Link to My Own Spreadsheet
Section: 12 Linked Spreadsheet: Counties, States, Provisional, Territories, & Nations
Section: 13 Links to Other Resources
Section: 01
Commentary, Special Reports, and COVID-19 Update Information3
Interesting Tid-bits (hopefully)
Fatalities and New Cases in the United States
Fatalities fell by 315 cases from the previous day, to come in at 392
yesterday. That was a 9.47% decrease from the same day the week before.
New Cases decreased by 8,478 from the day before, to come in at 31,857 yesterday.
That was an 8.87% increase from the same day the week before.
Fatalaties and New Cases on the Global Scene
Fatalities fell by 1,104 cases from the previous day, to come in at 3,710
yesterday. That was a 2.98% decrease from the same day last week.
New Cases fell by 41,013 from the day before, to come in at 241,947 yesterday.
That was a 6.63% increase from the same day the week before.
New Global Milestones
Early on Sunday morning, the Global Scene Declared it's 29 millionth New Case.
Later in the day, the Global Scene saw their Recoveries exceed 21 millon Cases.

Section: 02
The Following Addresses the Numbers Here in
the United States of America
Here we go...

New Cases Declarations fell farther away from the 50k level.
Please take note of the Resolved Percentage level on the right.
It's also informitive to look up the data columns to see how the
situation has changed recently.
Concept of adding in Active Cases and Serious Critical here, courtesy of amorphous
Here are more of our numbers...

As for deaths on the left there, we are nearing an important milestone in
in two to three days. There's a lot to be addressed concerning those
numbers. I think most of the adults in the room realizes the dynamics
behind them.
Active Cases are tracked in that next to the last column on the right.
Take note of the Serious/Critical situation on the right there.
Our Slice of the COVID-19 Pie
The growth of our slice of the pie has been increasing recently.
Here are the numbers I've been tracking, Globally Declared and Active Cases.

Our slices became smaller again yesterday. Liking this...
Active Cases in the United States / Chart
Unlike some of the other charts here, we should see a good rise and
fall at some point withone.
Note that this presents the single, seven, and fourteen day averaging versions.

Remember, these are not new Declared Cases. These are remaing Active Cases.
Active Cases are seeming to be flattening out right niow, instead of heading
down. We still have roughly 31,500 fewer Active Cases today than what we
had on the first. In recent days, they have started to increase again. We
are waiting to see how that plays out.
Testing and New Case Figures
Requested by stocksthatgoup
Some folks have shown an interest in seeing the COVID-19 Test figures compared
to the New Cases being declared. The following Data addresses that. The size
of it just doesn't seem reasoned to me.
Why/how could the posive portion of the popoulace vary ass much as 2.0% from day
to day? I could a lot easier see a 2.0% trend over three or four days. One day?
Nah.

You'll note the change in the level of Testing in the third column there
yesterday. Just to the right of that column, you'll see the postive
testing results for the day.
Take note of the fourteen day Positive Percentage change two columns from
the right. It's the lowest since 06/22.
The 3 day average and single day figures dropped nicely.
The Good news is that we have the lower days of the week just ahead.

The dark blue Fourteen Day average line is the one that interests me.
It's almost flat now, but it's still going negative for now.
The U. S. Stats / w 10 Day Averaging / Fr: 03/17
Requested by: Texas Eagle
This data and chart presents things in a little different way. In the
chart it is easy to see the relationship of these numbers.
The Chart will use the data all the way back to 03/17, but the data displayed
here will only go back one month.

Here is the chart to match.


I like the New Case Declarations line right now. They are ever so slightly
moving in the direction of flattening.
The active case line is very interesting right now. It crested a few days ago.
I have been saying I wasn't too happy with the Recoveries and Resolved Cases
lines there. At the present time they don't seem moving toward flattening any
longer. They may show some strengthling almost imperceptibly.
Compare to the rise of Recovered and Resolved cases on the Global Scene to see
a different more healthy trajectory. These look lethargic by comparison, but a
a little less so.
You can right click view to see the Global Chart enlarged.
United States Movers and Shakers...
I will present the U S States with the most New Cases and New
Fatilities rankings.
Here we go...

California and Texas continued their road-show here yesterday. They've been
leading these two columns for a few days now.
Section: 03
The Following Addresses the Global Numbers
without Mainland thereChina
Here is the first set of Data for the Global Outside China
Territories

New Case Declartations were the highest yet for a Sunday.
Fatalities, Recoveries, Resolved, Active Cases, and
Serious/Critical Cases - Globally, Excluding M/L China
Concept of adding in Active Cases and
Serious/Critical here, courtesy of amorphous
Here we go...

Active Cases rose here, although the numbers were smaller than normal.
The Serious/Critical cases fell off decently.
How is the Global Community Outside China Doing,
Without U. S. numbers?
Let's see...

This metric dropped down again yesterday. A lower reporting day of
the week was likely the cause.

The last columns there show more reductions as the lower reporting days
take hold of things.
Our blue column looks much better yesterday. Again, day of the week
influenced.


The blue line here still shows some progress. I'm hopeful it will continue.
Upticks do come and go.
The Active Cases outside China Globally / Chart
As in the U. S. version of this, we should see a good rise and fall at
some point these two.
Note that these present the one day and then 7 and 14 day averaging versions.


The two charts above had looked like they were revealing flattening, but as
the days went by, they began moving upward again.
Special Section on France, Germany, Italy, Spain, and the U. K.
Case growth.
Jim Noble mentioned he'd like to see the US numbers added here. I added them
in on 06/21/2020. I did not add them to the chart because it would have
dwarfed the European nations chart lines. (they would have been reduced to
about 15% of their normal size)
Let's Look at Some Numbers in Five Day Increments:


Spain - OUCH! (Will you look at Spain! Wow!)
France - Ooo
To be honest, it looks like all these nations are showing an inclination to
move up.
Span had been looking very bad, and despite some moving arund, it is just
headed up about as fast as it can get there. Up, up, up, up...
Frace is suffering the same fate.
Sweden and It's Neighbors, Who Has the Best Tactic Against COVID-19?
Sweden is doing its own thing with regard to isolating. I think most people
are aware of it by now.
Here are some numbers to help us look at this issue.


In recent days Sweden has edged up a little. It's not terrible, but it
isn't optimal either. Note that Sweden took around a 3,100 clearical
correction on it's case numbers on 08/27th. Just after Spain did that
recently, it made a dramatic move upward. I'm curious to see what happens
here.
The Nethherlands seems destined to intersect with Sweden within one to two
days.
Global Movers and Shakers...
I will present the top fifty nations with the most New Cases and New
Fatilities.
Here we go...

India continues to have an incredibly dominating New Case run here. It
took the top spot for Fatalities for the day also. It has done that for
several days now.
Global osChina Stats / w 10 Day Agveraging / Fr: 03/05
Requested by: Texas Eagle
This data and chart presents things in a little different way. In the
chart it is easy to see the relationship of these numbers.
The Chart will use the data all the way back to 03/05, but the data
displayed here will only go back one month.

Here is the chart to match.
This chart reveals a flattening of Active Case growth. There have been some
drops in the numbers of Active Cases, and then the size of their increased
numbers as they grow recently. Both are good signs of a more healthy situation.
In the the United States chart like this one, the Recoveries, and Resolved
Case lines have not shown near the strength as is revealed here with these
upward bound lines.
That chart is provided here, in a small version, but you can see it full size
if you right click view.
Section: 04
The Following Addresses the Global Numbers
including Mainland China*
Mainland China's numbers are 0.002% of today's total global numbers.
A Look at Declared, Resolved, and Active Cases, Includes M/L China
End of day figures follow:

We rose to 75.119% Resolved Cases yesterday Globally. The rise in this
column has been very reliable over recent times.
Fatalities, Recoveries, Resolved, Active, and Serious/Critical
Cases Globally, Including M/L China
Concept of adding in Active Cases and
Serious/Critical here, courtesy of amorphous

Active Cases rose and Serious/Critical cases fell off just a little yesterday.
Section: 05
the Mortality Report
Here is the data for four entities...
Here are the figures for the growing case totals for four entities.

We hear all sorts of stories about how these figures are wildly off. The CDC
has studied them and seems to think they may actually be on the low side of
things. I am providing the CDC Provential Numbers down below. Not sure if
anyone has a rock solid number. I doubt it is possible. This is what is
reported out by WoM and JHU. Check out the CDC numbers too.

Charts like this one only show growth. That's why I recently took the advice
of a FReeper and added in a new chart for the U. S. and Global outside China
regions.
Here are figures revealing the daily growth for those four entities.

Each specific region had nice dropping numbers yesterday. It was that time
of the week again.


Since the beginning of COVID-19's activity in the U. S., higher New Cases were
soon followed by elevated Fatalities. If we have gone to school on the data
of this disease, we know who should avoid exposure the most. So if the
demographic that has little to fear from the disease is out there getting
infected, it may not be a bad thing at all. If the Fatalities remain low,
vastly higher cases may simply increase the rapidity of the saturation of the
people in public who have already fought it off. And that may facilitate the
end of the disease. I'm sure others know this, but I did want to explain why
my thinking has fluctuated over time regarding these dynamics.
Here, let's look at data for the U. S. broken out by itself.

Liking the lower numbers, even if it is reporting related.

I'm looking for some break out of the mold patterns across the board, but
I'm just not seeing it. With some variances, week after week things look
pretty much the same. We are better than we have been at other times.
Hopefully that will become more pronounced in not the long a time.
Section: 06
Population Saturation
Here are figures revealing how many people in each population base represent one
case. I'm also showing what percent of each population base is infected at this
time.

This area is drifting from day to day, some better than others. This wasn't
one of the recent better days.
Nations With Lots of Cases
At the end of the day yesterday, there were:

Over 50% of the 215 nations we're tracking now, have declared over 5,000 cases,
but they have far lees of them still Active. Over 25% of the nations we're
tracking have delared over 50,000 cases along the way. None of them have
anything near their declared amount remaining active. Keep that in mind.
Daily Case Report Evaluation
I'll be keeping tabs on the daily tallies for days of the week for a while. Folks have
noticed some patterns of larger and smaller data entry on certain days, and on Fridays
sometimes the numbers get noticeably larger because of it.
And we now know Thursdays have potential to break out also. Yikes!
IMO Let's check out the numbers and a chart.


Yesterday had the highest New Cases Declared yet for a Sunday. That makes
four days in a row, with Friday having been the largest day of Declared New
Cases on record.
Section: 07
The Top 200 Counties in the U. S., by Number of Cases
This little report lists 200 Counties in the United States in declining Case numbers.
There is also a listing that is alphabetical. This report list only the entities
and the number of Cases in the two different sorts.
It will also be available as a downloadable Excel file in Section 12.

For months Puerto Rico was showing up with the Counties. That stopped in early July
if memory serves me well.
Section: 08
States of the Union and the District of Columbia, Compared to Each Other
Each of these pages is sorted differently. Look at the red header above
the columns to see which column was used for the sort on any given page.

For your review...

For your review...

For your review...

For your review...

For your review...

For your review...

For your review...

For your review...

For your review...
If this area interests you, please use this LINK to the source, and review
the lengthy description and explanation of it's development process.
There are two reports. The presentation above comes from the second one,
and the detailed segmented information below it, may interest you.

These can now also be found under the states on the Alphabetical list. The
states and these entity's numbers should be combined to match that of the
U. S. figures each day.
Section: 09
The United States, Where it Ranks With Other Nations?
Each of these pages is sorted differently. Look at the red header above
the columns to see which column was used for the sort on any given page.
The U. S. will be highlighted red here so we can find it easily in the list.
There was 215 nations on this list last night now. I didn't want to post
seven lists with 215 nations on it, so I picked the top 50. Coincidentally,
one report category had the U. S. at 41st, so it wasn't showing up on the
list with the 31 top nations on it. That wasn't the reason why I extended the
list length, but it did work out well.
I work on the nations right next to the states on my spreadsheet. The
states with the District of Columbia come in at a total of 51 lines.
I decided to keep the international reports near that length, and 50
was good enough.
Here we go... for your review.

For your review...

For your review...

For your review...

For your review...

For your review...

Around 06/23, China started putting out it's testing numbers. I thought
they were suspect. The number they put out was 90,410,000. Ours and most
everyone else's numbers are specific. For instance on 06/28, our number of
of tests at the ned of the day was 32,592,368. That specificity separates it
from the number China put out. It was rounded to the 10 thousandth place. In
addition, China has not updated that number once. So I do not inlude China in
the Nation's Comparison Sort regarding Testing, and any place that reports out
global testing numbers for a top level comparison.

We remained at 19th place here yesterday.
Over the last month we've been in this rut from 19th to 16th place..
Section: 10
Here is what it is all about. From January 20th to the present.

This concludes our look back at yesterday's data. Take care...

Section: 11
Data for this Report Sourced From:
LINK WorldoMeters
LINK Johns Hopkins University
The Center for Systems Science and Engineering (CSSE)
LINK United States Center for Disease Control - Provisional Numbers
Listed in the order of current utilization...
LINK You are Invited to Review My COVID-19 Spreadsheet (XLSX)
There is not an XLS version available for distribution at this time.
Section: 12
Other Features:
LINK US Counties200, States & DC51, Territories & Other Entities11, Nations219,
and the CDC Provisional Counts53
Five Excel Spreadsheet datasets you can sort for your own studies...
Section: 13
Links to other resources:
I cannot vouch for these sites. Please use your own judgement.
LINK Adventist Health Coronavirus Resource Hub - Scroll down for useful info
LINK Antibiotic Vitamin, the (Vitamin D)
Good article on Vitamin D's likely role in prevention of infection. Thanks Blam.
LINK CDC Data for Download - Scroll down - Excel required. Includes death stats.
LINK CDC National Center for Health Services
Provisional deaths as determined by review of vital documents. Much lower...
LINK CDC Secondary Data and Statistics - Portal Entry / Look around
LINK Coronavirus (COVID-19) Map
LINK Coronavirus infection risk may be reduced by Vitamin D
by Former CDC Chief Dr. Tom Frieden
LINK Coronavirus Spread Quickly Around the World in Late 2019, Study Shows
the University College London Genetics Institute
LINK COVID-19 Deaths Broken Out by Thirds, 05/07/20 Map of US Counties
Very revealing display of Concentrated Death Zones - thanks hoosiermama
LINK COVID-19 First U.S. Case, Treatment, features Remdesivir
New England Journal of Medicine article
LINK Cytokine Storm, med Actemra, Physician near death saved
LINK Diamond Princess Review at 634 Case Point of Eventual 712
LINK Hydroxychloroquine Article: International Poll
Daily Mail Reports, Most Effective Treatment According to 6,000 Physicians
LINK Hydroxychloroquine Has about 90 Percent Chance of Helping COVID-19 Patients
the Association of American Physicians and Surgeons, reports 91.6% of patients improved clinically
LINK IHME - Institute for Health Matrix and Evaluation
LINK National Institutes of Health - Cornavirus (COVID-19)
LINK Nasal Irrigation is the Key, COVID-19 Related
LINK New York City - interesting breakdown, borough, age, sex
LINK On the Origin of CCP Virus, A Documentary Movie (turn up the sound)
Epoch Times: I highly recommend this very well documented report.
LINK Rt COVID-19
Calculates and displays the Rt Factor for each state. Thanks FreedomPoster.
LINK World Health Organization

My take is we are not out of the woods yet. Florida and California still the main problems.
I’m in Florida...is Covid even still a thing anymore?
Apparently, it’s all over, but no one told the mask Nazis in some counties. It’s going to be hard for them to give up their assumed powers. What a pitiful life!
Pennsylvania Nursing Home (LTC) death stats for September 13 & 14
There were no new COVID deaths in Pennsylvania on September 12-13.
Figures from the PA Department of Health as of midnight September 13-14.
LTC deaths = 5297
Total deaths = 7869
LTC deaths as percentage of total = 67.3%
Worst percentage in the USNE.
California, Texas, and Florida are experiencing a higher level
of New Cases.
Even so, we’ve seen who is vulnerable and who isn’t. We need
to open up and treat this like the flu.
This was always “the flue”. It was no more of a pandemic
than the season flu was.
Where are the people now who said this wasn’t the flu, and
tried to put down anyone who basically said were weren’t
going to lose more pople from this, than we didn’t the
normal flu?
We open up. We go about business as usual. Some people
will die as they always do from the flu.
Our nation moves on.
I just read an excellent (but very long) summary of where we stand now on all the most important COVID issues.
The paper was written by two physicians and an epidemiologist.
It is focused mostly on Europe and the UK.
Some interesting new data was submitted.
Most important...
The authors assert that at least 30% of the population had some level of immunity based on prior exposure to different strains of the corona virus.
The authors also assert that the infection rate in Europe has reached 25% of the population. Thus, they conclude that we have passed the herd immunity point.
They also discuss an enzyme which is minimally present in children, but heavily present in adults and the elderly, that is responsible for the cell “hook” that Corona attaches to. This may explain why children have such high resistance to COVID-19.
The paper is posted at Lockdown Sceptics.org.
“How Likely is a Second wave?”
https://lockdownsceptics.org/addressing-the-cv19-second-wave/
Florida still hits over 100 dead per day according to the stats.

•Blue line represents projected death totals.
•Yellow line is actual death totals based on WorldofMeters.info data.
•Purple line is actual daily cases offset by 14 days.
•Red line represents projected daily deaths.
•Black extension lines are trend lines.
Below is an interesting chart. It's too bad the US switched to HHS as guardian of stats when our case numbers begin to show a significant decline. It leads to questions about the data's integrity. I intend to create a similar chart using fatalities instead of case numbers as I consider that data more accurate.
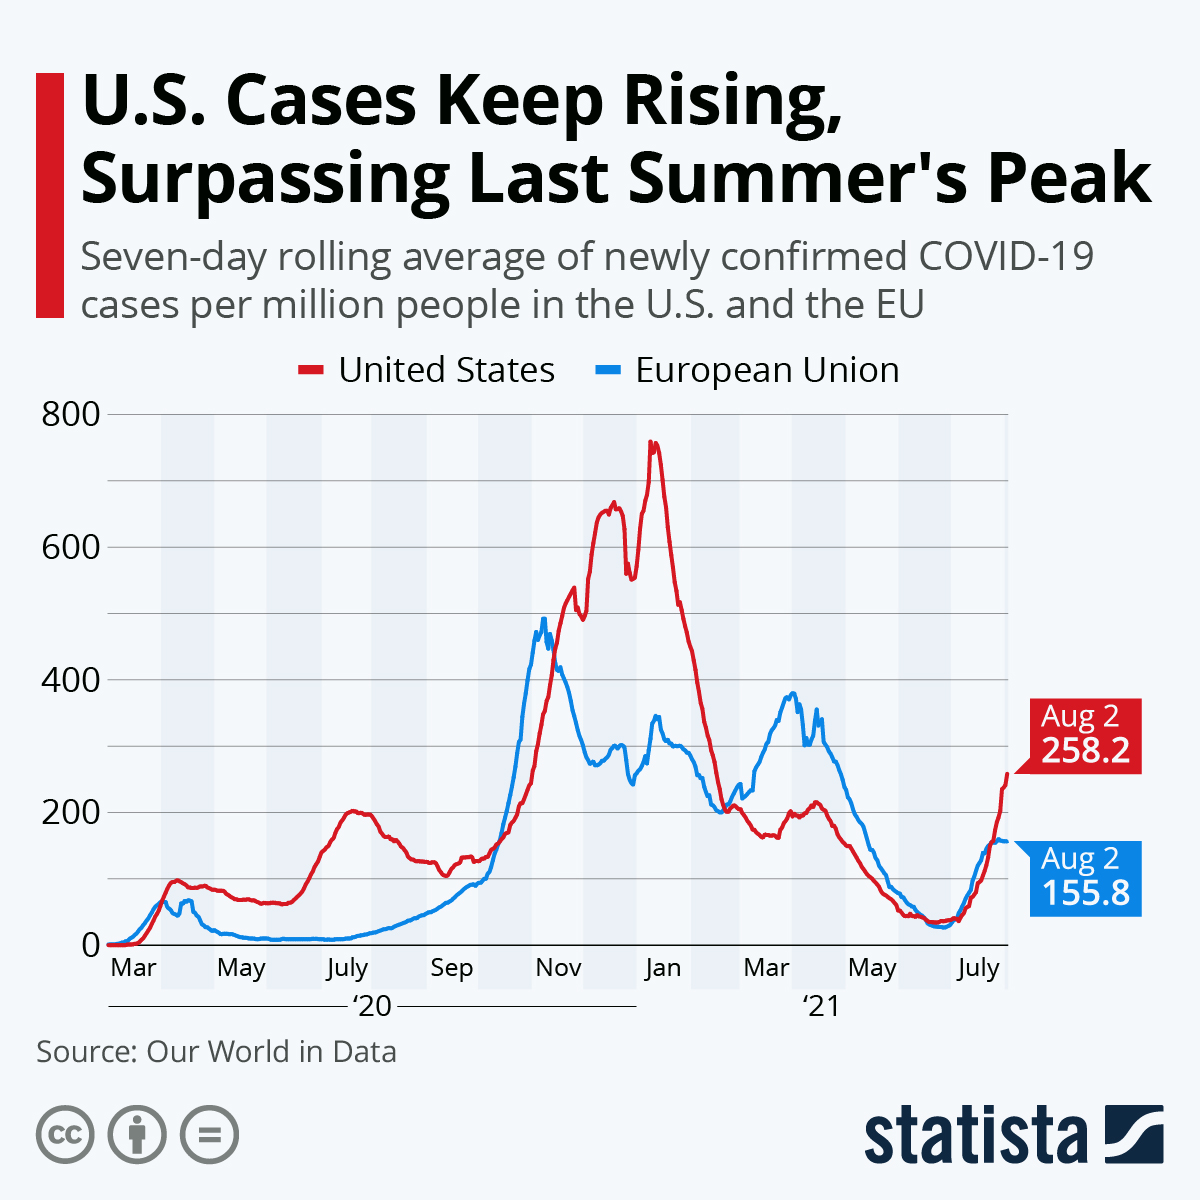
Nevertheless, the chart is interesting. I think it proves that the amount of international travel leads to COVID spreading more rapidly in some countries than others. I wonder if it isn't intentional and, therefore, why international/cross-border travel is such a factor.
After successfully keeping new infections at a very low level for two months, case numbers started trending upwards in mid-July as cross-border travel [In the EU] facilitated the spread of the virus.
I don’t see how you can show anything but mere correlation in EU over that opening.
You’d need evidence from spread of specific genomes- specific strains.
https://nextstrain.org/ would be the place to find that, but I can’t find any such info there anymore. Maybe you’ll have better luck if you wish to explore. They used to have ‘trees’ showing the spread of different strains but either they don’t or the ‘trees’ have gotten too complicated for me to process.
And I’m beginning to think “deaths” has been a worse metric than we hoped- though it was the best we had.
Specifically that earlier “excess deaths” show covid deaths were undercounted.
Very recent data may show (may be too soon to say) “excess deaths” (above covid deaths) much less now.
If so, the effect on computations involving deaths would make past metrics too hopeful, and present metrics too pessimistic. Which is what my gut tells me- so I may be inclined towards this view for invalid reasons.
Actually, what it means is they recorded 100 deaths that day. That does not mean 100 people died that day. Deaths sometimes take weeks to months to make a final determination whether to be recorded as a COVID related fatality. So, the numbers you see may have occurred over the past weeks/months. Additionally...there are 67 counties in FL...that’s less than 2 deaths/day (recorded). Considering the population of most counties, this is a very small number and on par, or even less with other maladies.
Careful, or you're going to talk me out of this extra work for a plate that currently runneth over from many real-world responsibilities and chores. :)
That's a neat link, btw. Thanks!
I guess that does throw a spanner in the stats. Still it seems Florida is the chief reason the US numbers are up in the air. We can’t say mission accomplished quite yet.
Disclaimer: Opinions posted on Free Republic are those of the individual posters and do not necessarily represent the opinion of Free Republic or its management. All materials posted herein are protected by copyright law and the exemption for fair use of copyrighted works.