Posted on 04/28/2020 2:12:18 AM PDT by DoughtyOne
PING LIST - Please contact me as needed...
COVID-19 Update
As of 04/27/2020 23:45 PDST Johns Hopkins University - Capture Nations Informaton
As of 00/00/2020 23:45 PDST Johns Hopkins University - Capture Counties Informaton
As of 00/00/2020 23:46 PDST Johns Hopkins University - Process JHU Data
As of 00/00/2020 23:59 PDST WorldofMeters - Document Core Numbers
As of 00/00/2020 23:59 PDST WorldofMeters - Capture Nations Informaton
As of 00/00/2020 23:59 PDST WorldofMeters - Capture States Informaton
As of 00/00/2020 00:00 PDST WorldofMeters - Data Processing begins...
As of 00/00/2020 ??:?? PDST Publish COVID-19 Update - 00/00/00
Thank you for stopping by to check out the COVID-19 Update.
Here you can find...
Section: 01 Commentary, Special Reports, COVID-19 Update Info, & System Notes
Section: 02 the United States Situation
Section: 03 the Global Community Situation Outside China
Section: 04 the Global Community Situation Including China with reservations
Section: 05 the Mortality Report
Section: 06 Miscelanious Reports of Interest
Section: 07 the United States, Counties (alphabetical / case no descending)
Section: 08 the United States, States Ranked with the Other States Territories at Bottom
Section: 09 the United States, Ranked with Other Nations
Section: 10 the End of this COVID-19 Update
Section: 11 Data Sources and a Link to My Own Spreadsheet
Section: 12 Link to Spreadsheet: Our Counties, States, Territories, & Other Nations
Section: 13 Links to Other Resources
Section: 01
Commentary, Special Reports, and COVID-19 Update Information3
Interesting Tid-bits (hopefully)
Link Directly to Specific Section
Wanted you to be able to go right to the section that interests you
the most, so I have set that up. Now, if there is an issue with it
that I am unware of at this point, I'll have to delecte the thread
and repost it a few minutes later without links.
This feature will also allow me to link you to a specific cell at
times, when it will helpful to do so.
At various places in this Update, you'll see menu looking like it does
here. Click that to go back the menu listing at the top of the Update.
You will find that clickable "menu" at the end of each section, and
directly after a cell I link you to for timely information.
Hopefully this will work out and remain a nice feature.
Is There's Real Change Coming?
I like some of the things I'm seeing in my data, and tomorrow I will
address them here. Hopefully the numbers tomorrow will continue to
look good, and support the things I think I'm seeing. I have a few
categories showing movement in the right direction. They're not as
big as the noticable drop in numbers, but all together they are
supporting the premise there is real movement in the right direction.
Sweden
We have been looking at Sweden's numbers compared to it's neighbors.
In that group, Sweden doesn't look too hot comparitively. I recently
took note of it's standing compared to France, Italy, Spain, and the
U. K. You may want to check that out in the international comparisons.
Look at the Deaths Per Million standing. Sweden has a significantly
lower figure than any of those four nations, and they've been on full
lockdown.
Earlier tonight someone took great exception to this comparison, since
Sweden counts it's deaths pretty close to the vest. That's reasoned to
point out, however... if Sweden comes in under those other nations, we
can pad Sweden's numbers to a degree and they are still competitive.
I'm not making the case that Sweden has found the exact secret to all
this. I just don't think it's all wrong on it either, and I don't want
to dismiss it. Link to specific report
Section: 02
The Following Addresses the Numbers Here in
the United States of America
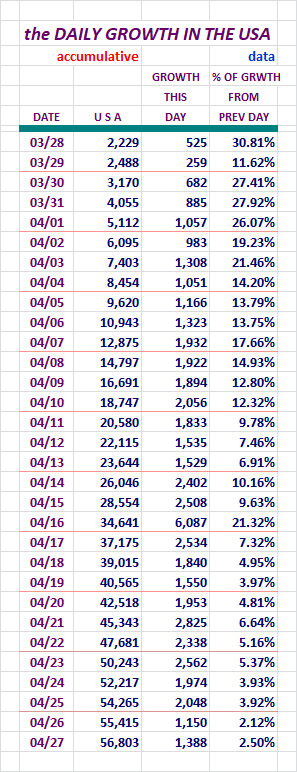
Okay start smiling a little now, as a warm-up.
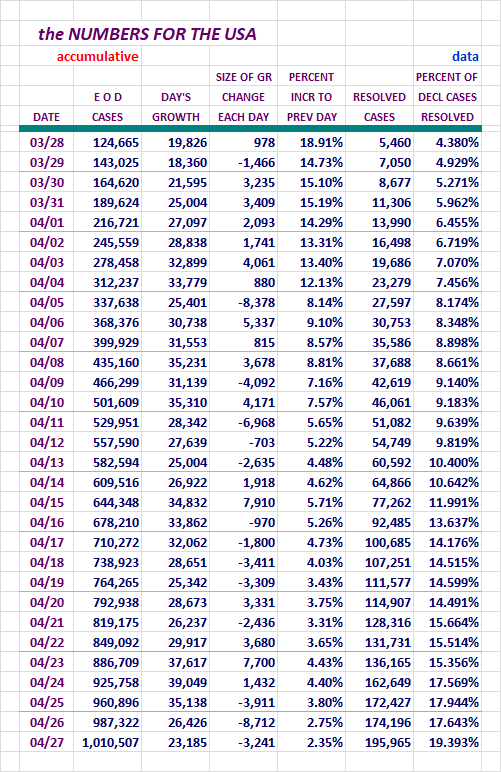
Look at that. That's the lowest number of new cases since March 30th.
It's pretty hard not to see that as a major development. It still
makes me nervous when it happens on a Sunday or Monday.
Fatalities, Recoveries, Resolved, Active Cases, and
Serious/Critical Cases in the United States
Concept of adding in Active Cases and Serious Crital here, courtesy of amorphous
Here's more of our numbers...
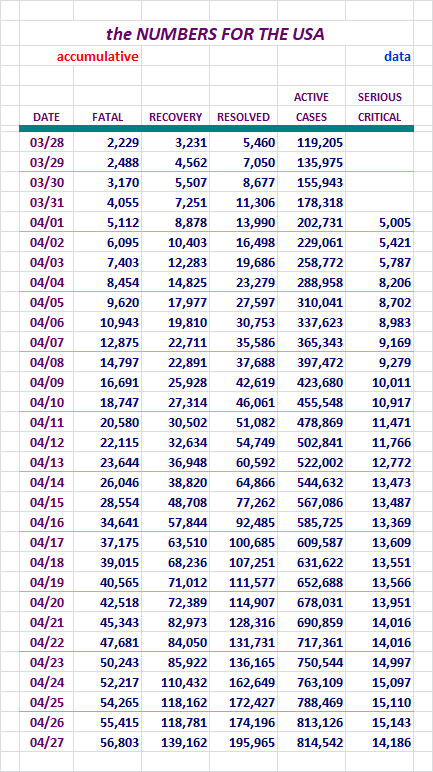
The number of fatalities remain low again today. It was up a little over
the growth the previous day, but it was no where near the 2000 plus range
we've been in. Very nice.
Our Slice of the COVID-19 Pie
The growth of our Slice of the Pie has been slowing. On the 16th it actaully
went netative for one report row on my spread-sheet. Luckily it was the EOD
figure so you could see it.
Here are the numbers I've been tracking, Globale Declared and Active Cases.
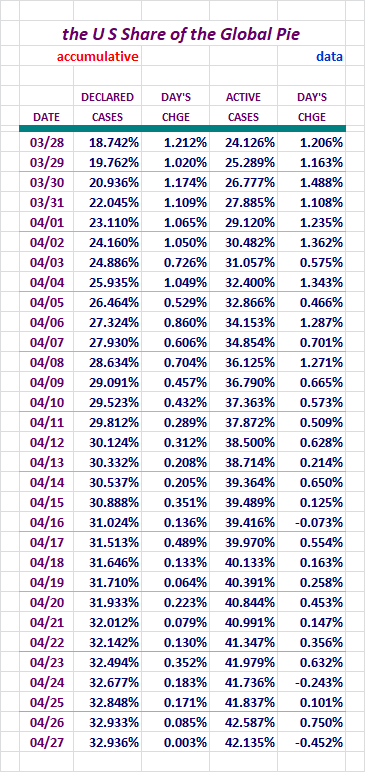
The slice of the Declared Cases grew in a miniscule measurment. The
active cases took it's biggest drop yet. Remember, that number has only
grown for several months, and here it's has declined just short of half
a percent. Very good.
Section: 03
The Following Addresses the Global Numbers
without Mainland China
Here is the first chart for the Global Outside China Territories
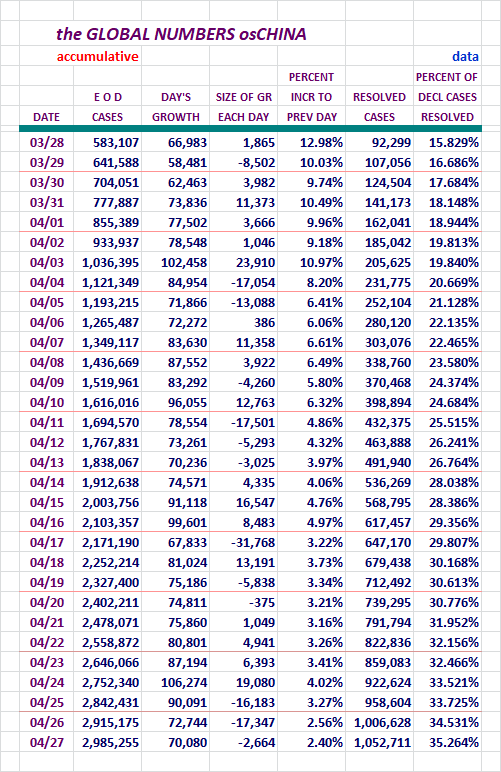
That one day growth there is the second lowest figure since March 30th.
Even if things go up again tomorrow, these last two days would be hard
to explain if the direction hasn't taken a turn. Another day or two
would be nice to see how close to this or better we can manage.
Fatalities, Recoveries, Resolved, Active Cases, and
Serious/Critical Cases - Globally, Excluding M/L China
Concept of adding in Active Cases and Serious Crital here, courtesy of amorphous
Here we go...
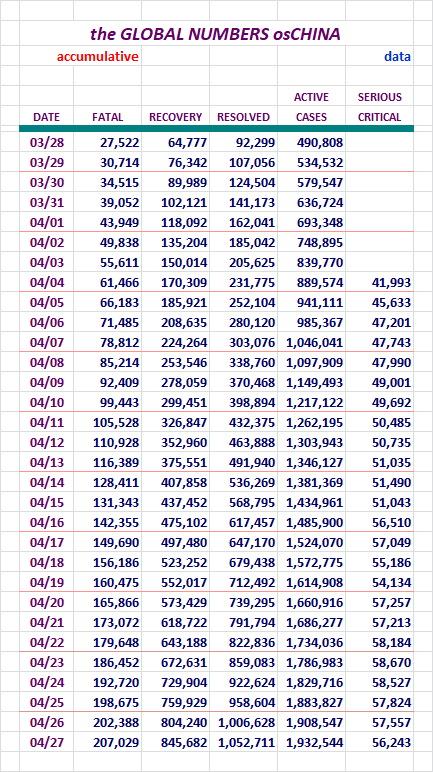
Fatality growth has slacked off here also.
How is the Global Community Outside China Doing,
Without U. S. numbers?
Well, not too good yesterday...
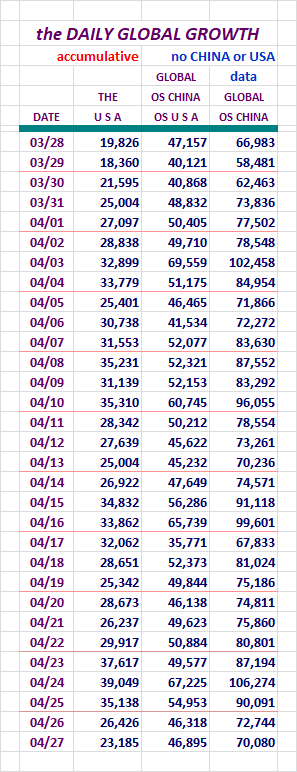
The level remained constant at this new count location.
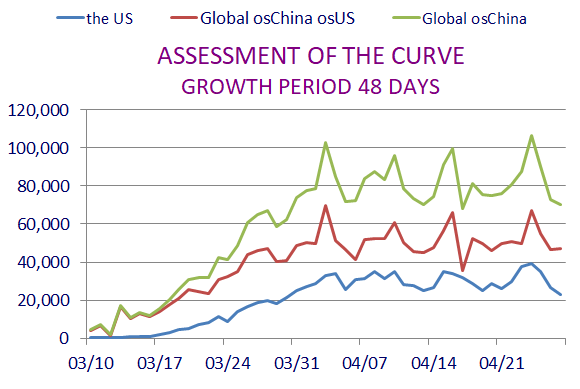
The first two charts look good, but the third seems to carry
over numbers from days before and remain high. The first shows
what looks what looks like weekly swings up and down. I'm
hopeing we don't see a pronounced move up tomorrow.
Special Section on France, Germany, Italy, Spain, and the U. K.
Case growth.
Lets Look at Some Numbers in Five Day Increments:
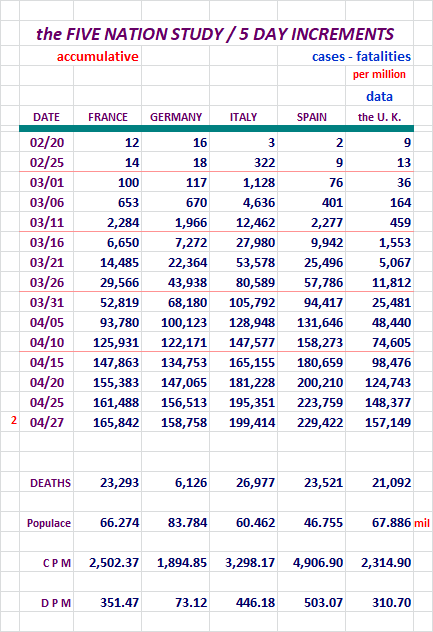
Germany is looking pretty good there. They've kept their deaths down.
Compared to the others, their numbers are impressive.
France seems to have taken a turn in the right direction. In fact both
France and Germany have veered away from the rapid rise in cases compared
to the others.
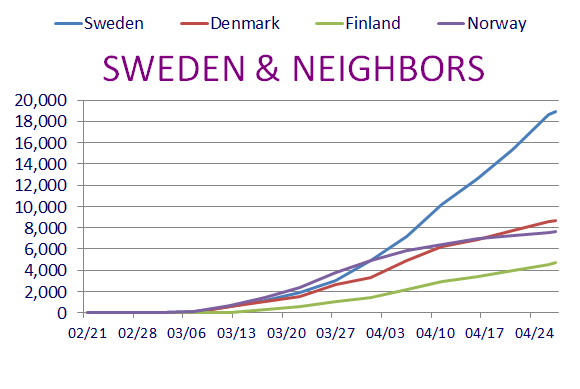
Sweden and It's Neighbors, Who Has the Best Tactic Againt COVID-19?
Sweeden is doing their own thing with regard to isolating. I think most people
are aware of it by now.
Here are some numbers to help us look at this issue.
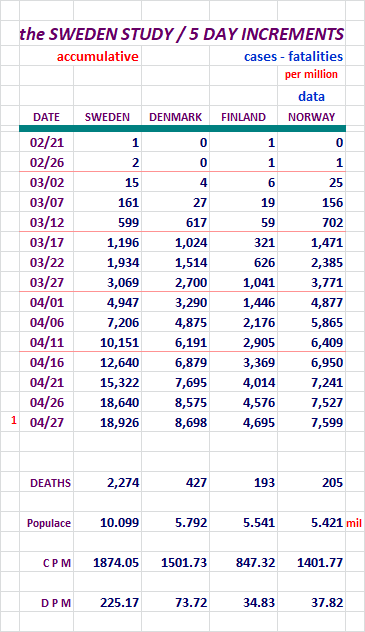
As a good adendum to these figures, I invite folks to check out the
international comparisons, with regard to Deaths Per Million. As with
any metrics here, these are not the total answer to anything. This
is simply more information to consider.
Finland is still looking good.
Check out Sweden's DPM against, France, Italy, Spain, and the U. K.
Link to specific report
Section: 04
The Following Addresses the Global Numbers
including Mainland China*
Mainland China's numbers are 0.03% of today's total global numbers.
A Look at Declared, Resolved, and Active Cases, Includes M/L China
End of day figures follow:
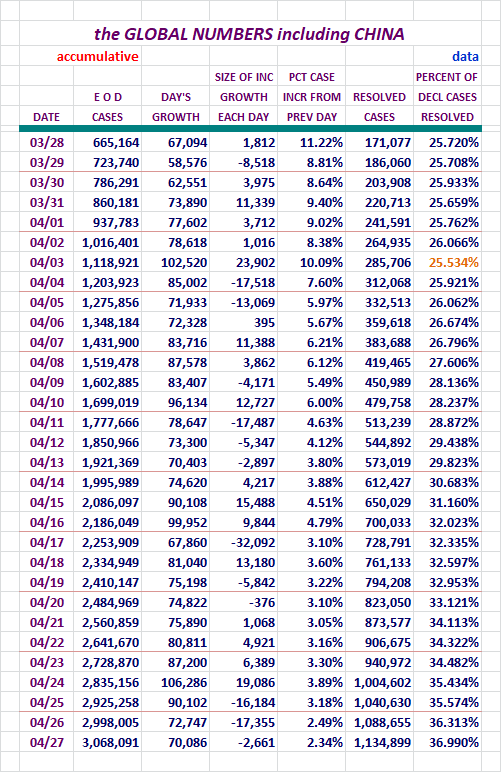
That recovery percentage continues to climb. It looks like we're headed to
40% and above in the next few days.
Fatalities, Recoveries, Resolved, Active, and Serious/Crical
Cases Globally, Including M/L China
Concept of adding in Active Cases and Serious Crital here, courtesy of amorphous
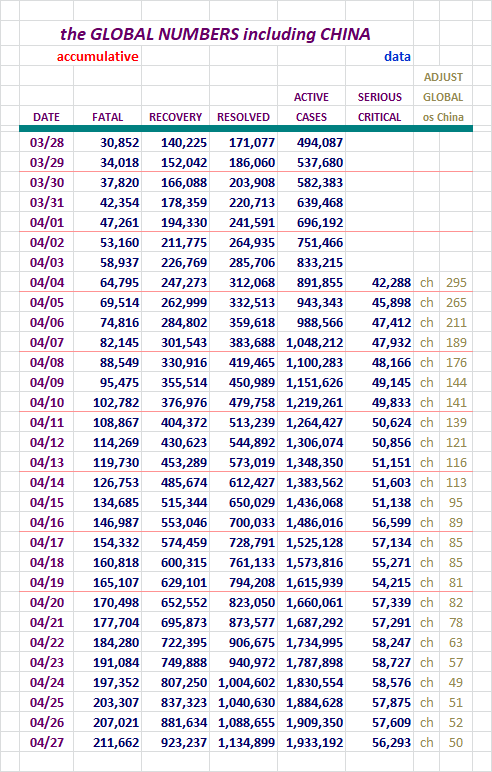
Not much to say here. Big numbers getting bigger...!
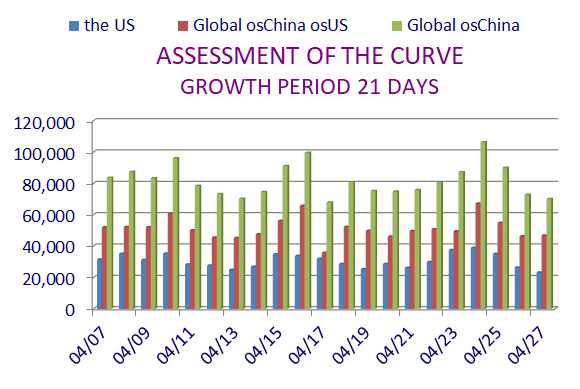
Section: 05
the Mortality Report
Making an effort to provide more mortality numbers these days.
Hopefully these upcoming numbers and charts will help with that.
Our numbers are big enough that they can hide the finer nuances of the
Global numbers outside China. For that reason, I strip our numbers off
that group and report them separately for this area of study.
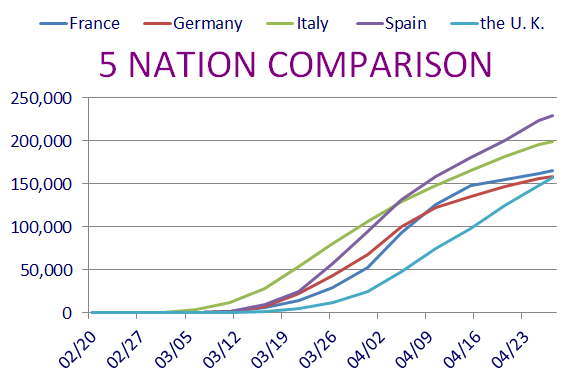
Here are the figures for the growing case totals for four entities.
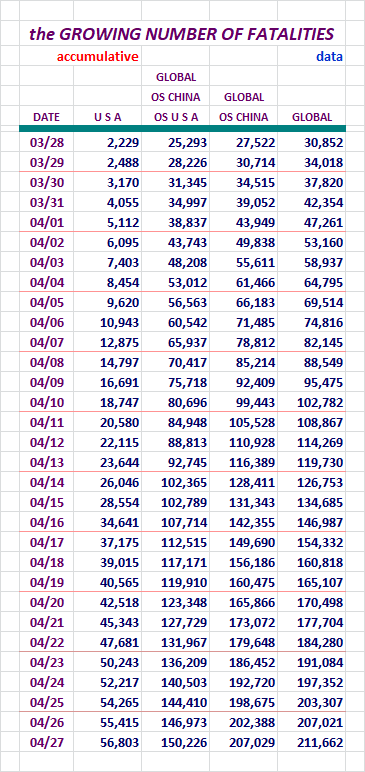
Here's the chart to go along with those figures.
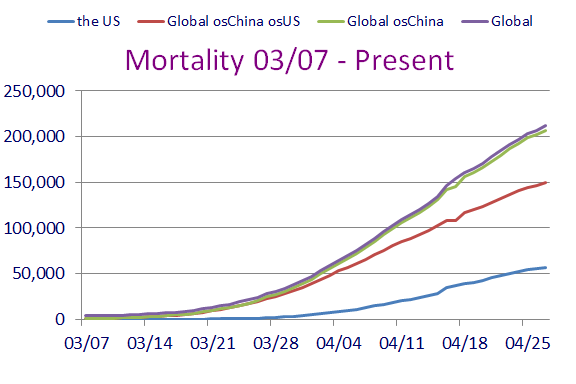
Looks pretty ominious there doesn't it.
Here are figures revealing the daily growth for those four entities.
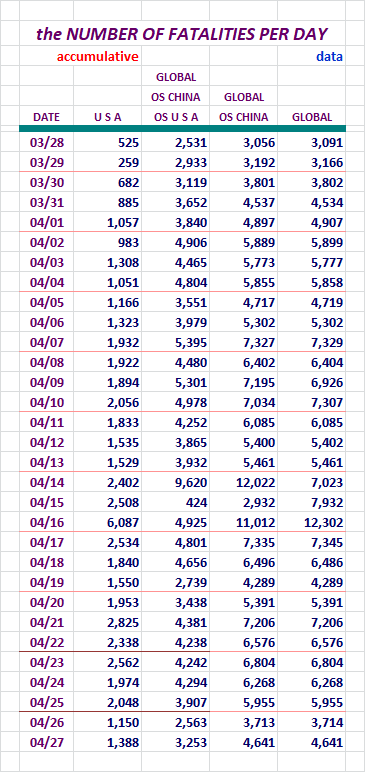
The numbers fell off considerably the day before yesterday, and held firm
down below the 2,000 and above region we had been hanging out in.
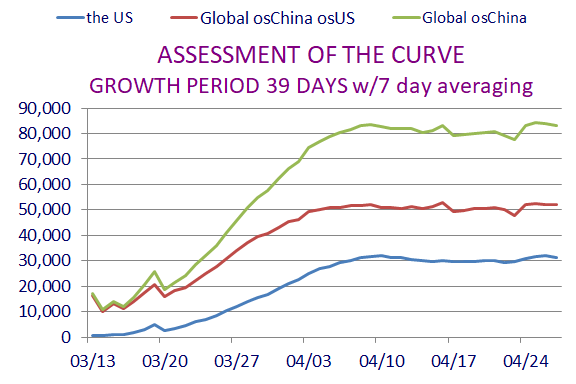
Here's two charts to go with the above data.
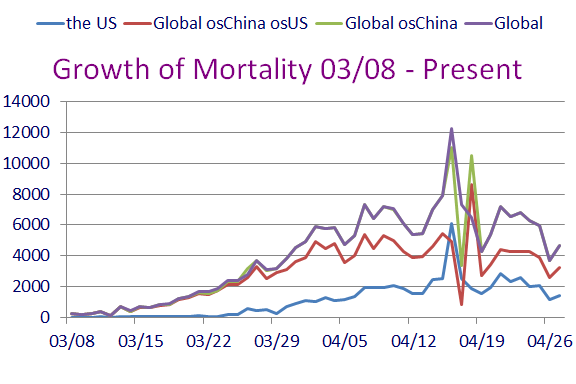
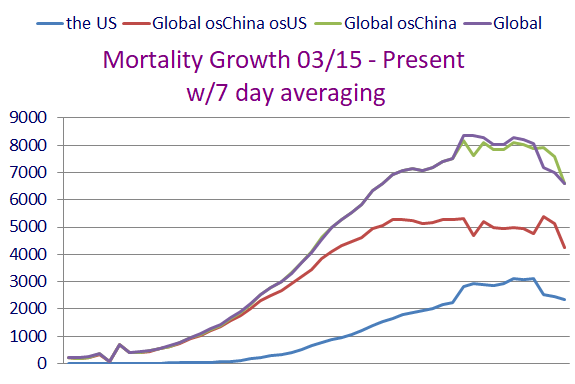
This time the seven day averaging chart looked very promising
Here, lets look at data for the U. S. broken out by itself.
Too good to be true? We'll see. Hope not...
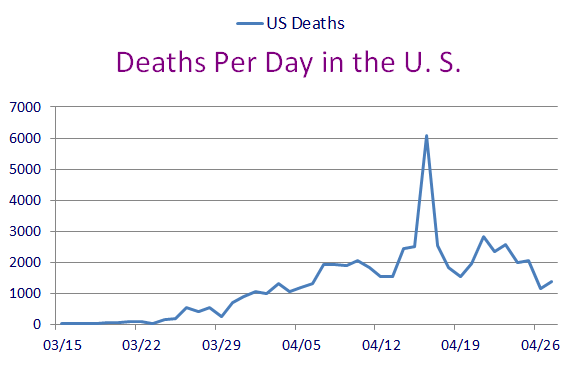
Looks nice...
Section: 06
Population Saturation
Here are figures revealing how many people in each population base represent one case.
I'm also showing what percent of each population base is infected at this time.
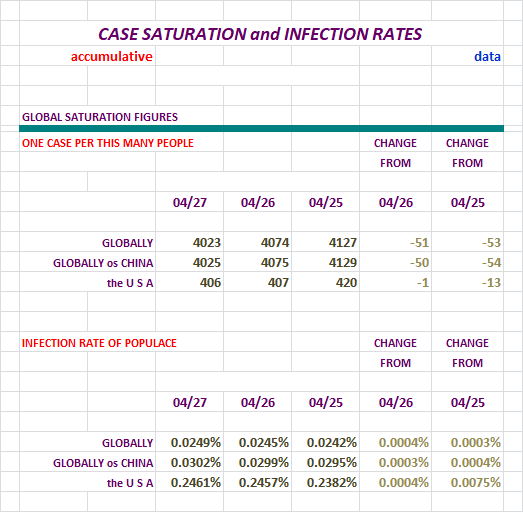
It looks to me as if we are stalling in both considerations here.
A reversal would be nice. That will happen when active cases start
to drop. Still, look at the size of movement there. Almost none.
Nations With Lots of Cases
At the end of the day yesterday, there were:
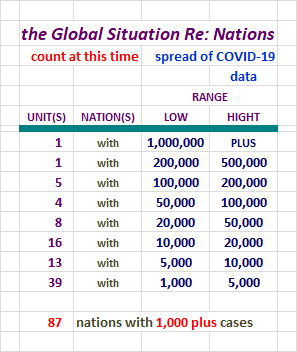
That's a whole lot of nations there. With over 1,000 in each one, we know
that over time they are potential declared cases time-bombs.
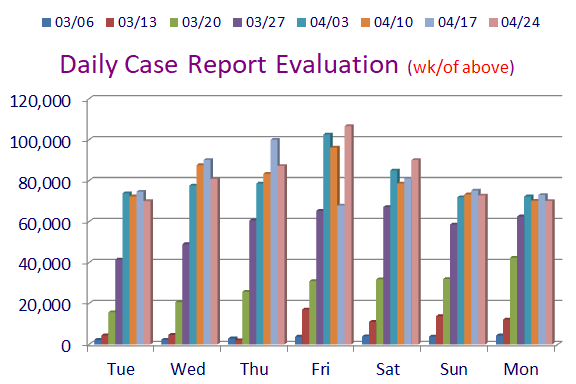
Daily Case Report Evaluation
I'll be keeping tabs on the daily tallies for days of the week for a while. Folks have
noticed some patterns of larger and smaller data entry on certaind days, and on Fridays
sometimes the numbers get noticably larger because of it.
And we now know Thurdays have potential to break out also. Yikes!
Let's check out the numbers and a chart.
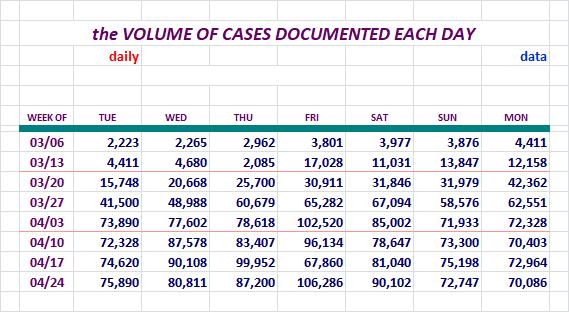
There's one of the reasons why I'm not to glib about the nice drop in
the numbers reported yesterday. Sundays and Mondays are two days on
the low end of the spectrum normally.
If you're missing the listing of the states here, please check out
Section 08.
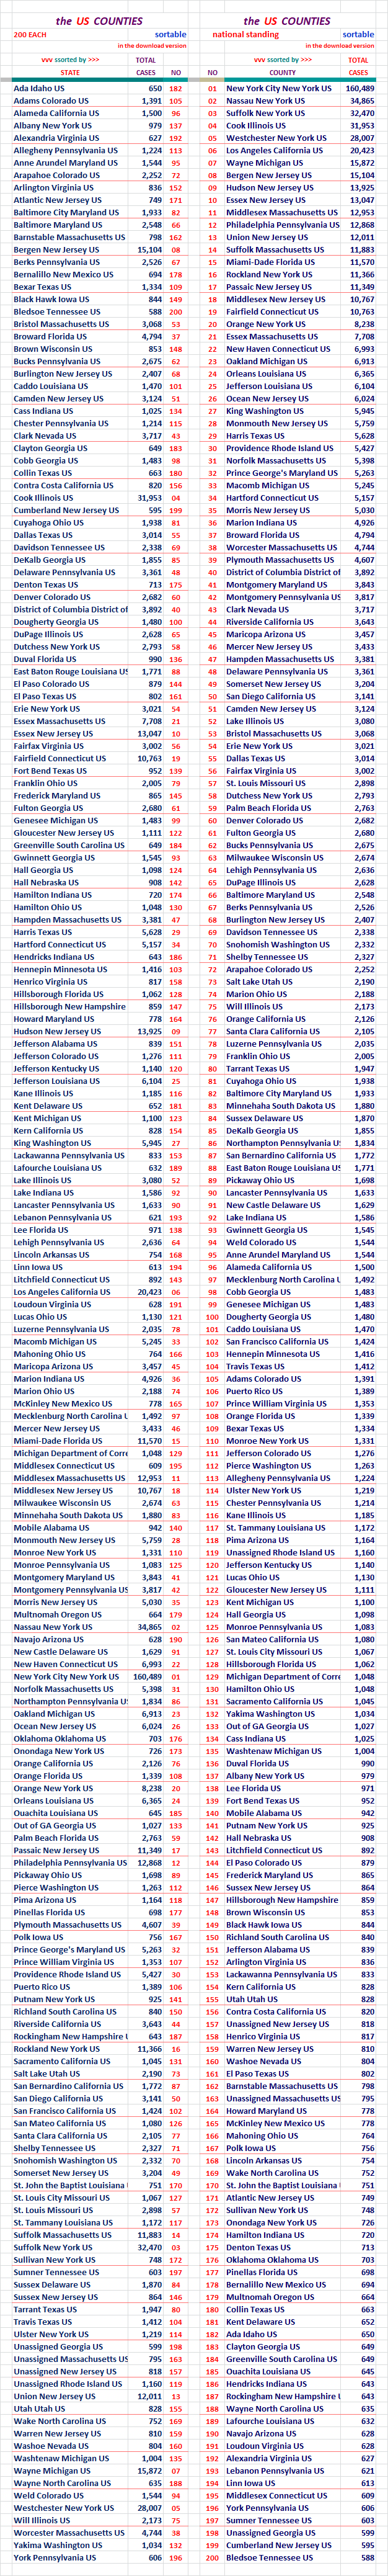
Section: 07
The Top 200 Counties in the U. S., by Number of Cases
This little report lists 200 Counties in the United States in declining Case numbers.
There is also a listing that is alphabetical. This report list only the entities
and the number of Cases in the two different sorts.
It will also be available as a downloadable Excel file in Section 12.
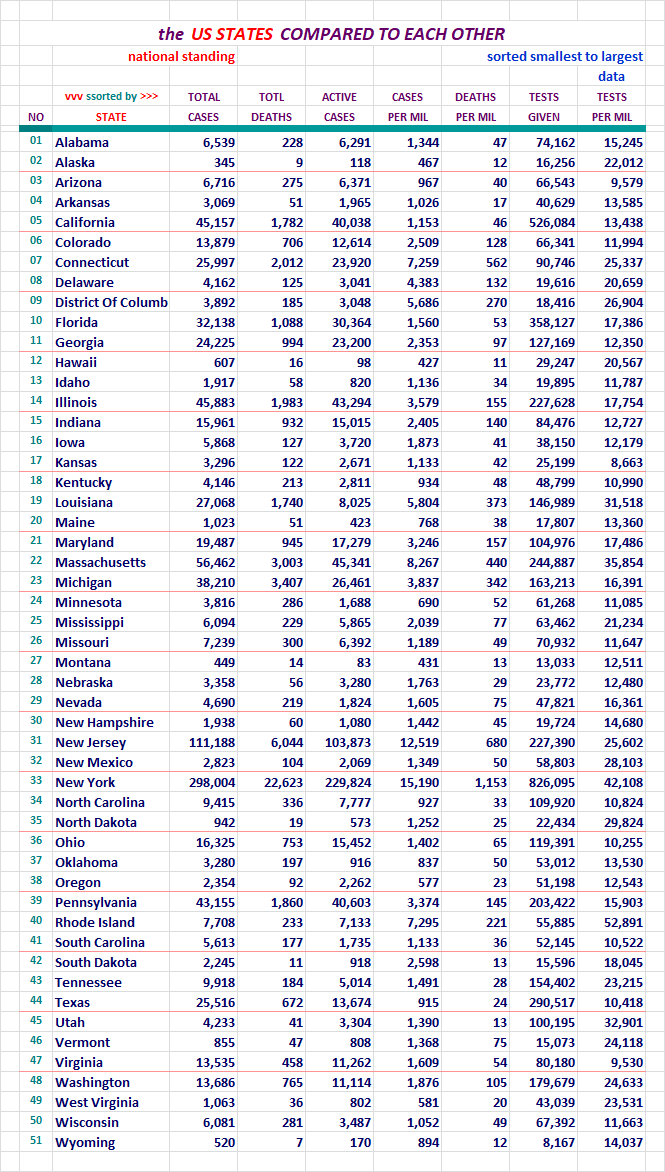
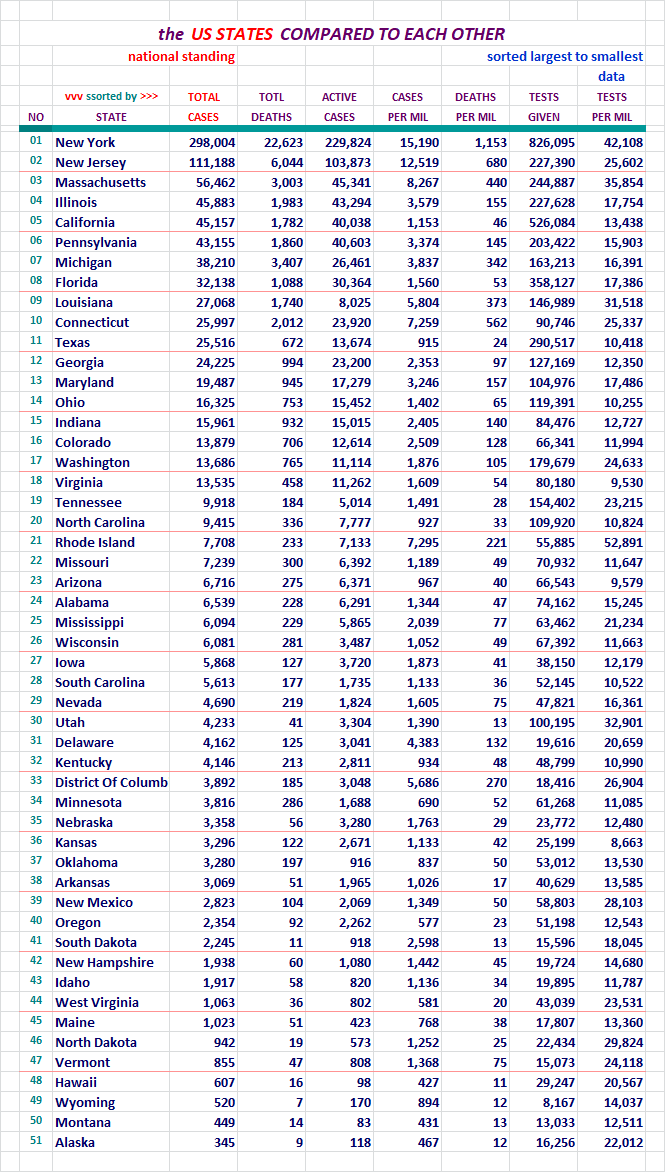
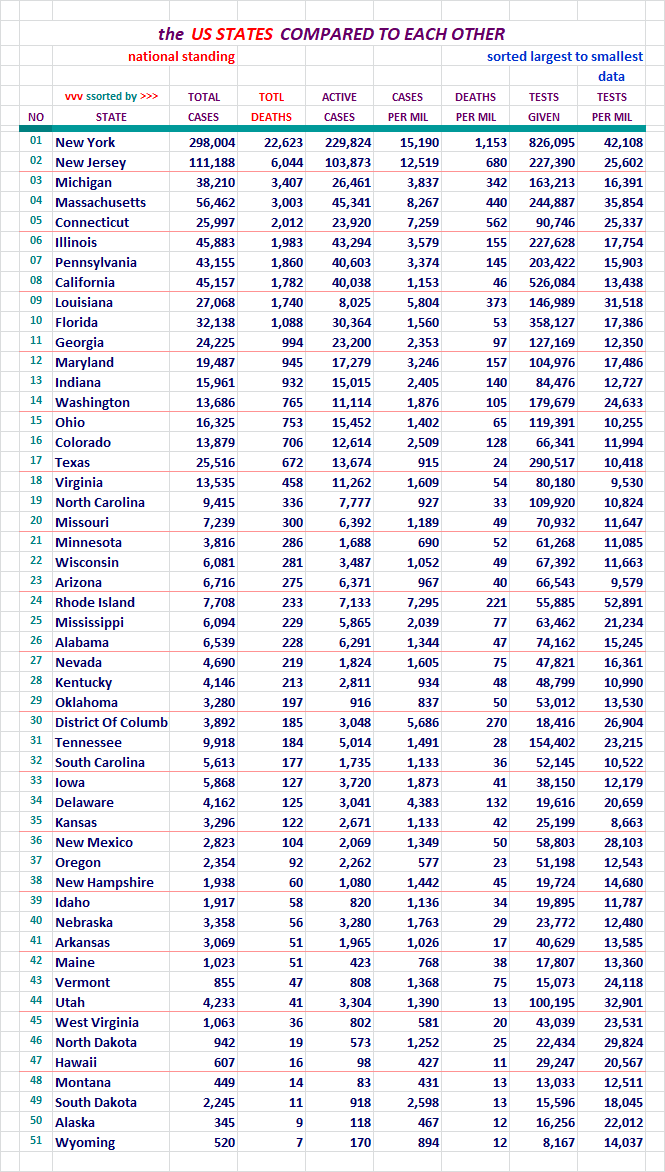
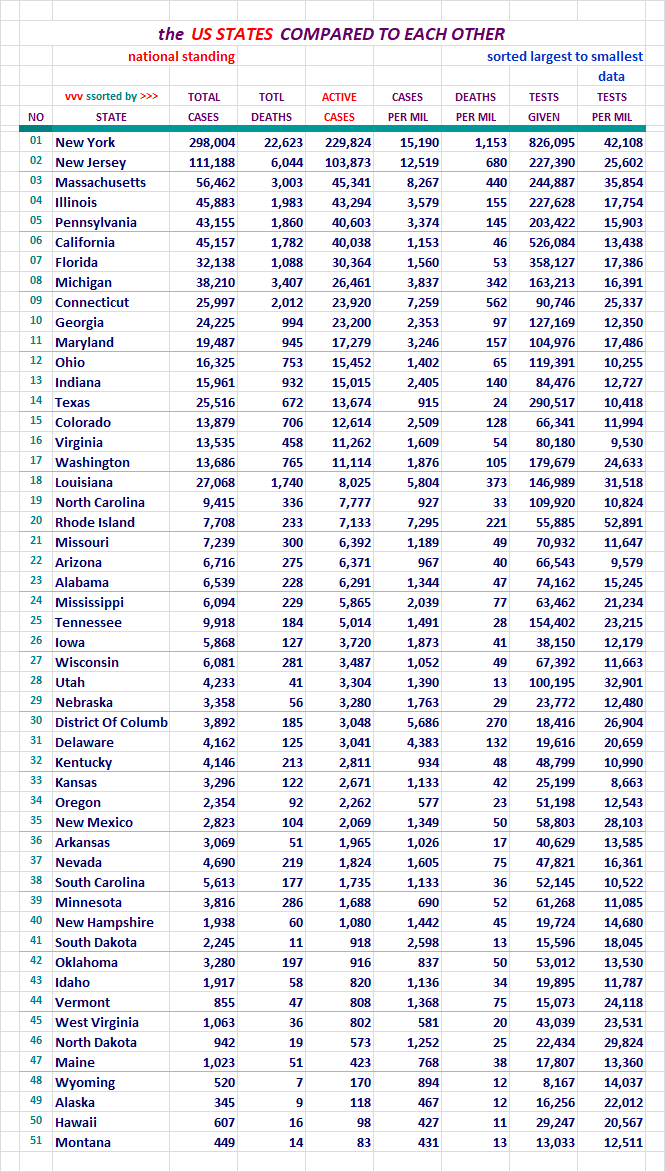
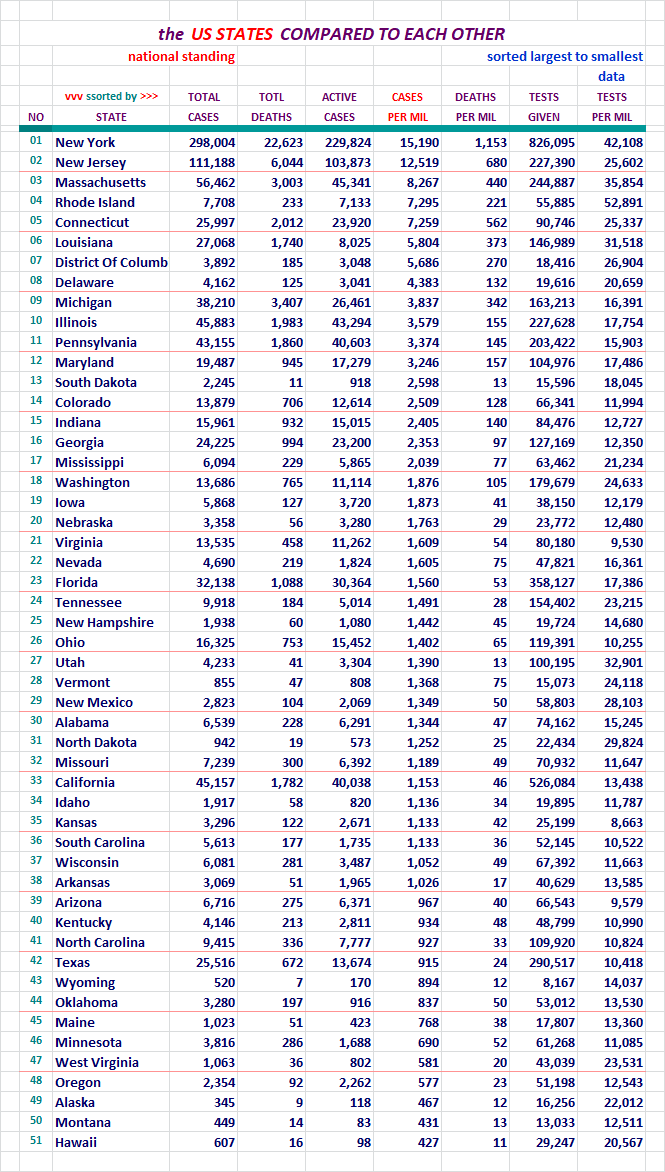
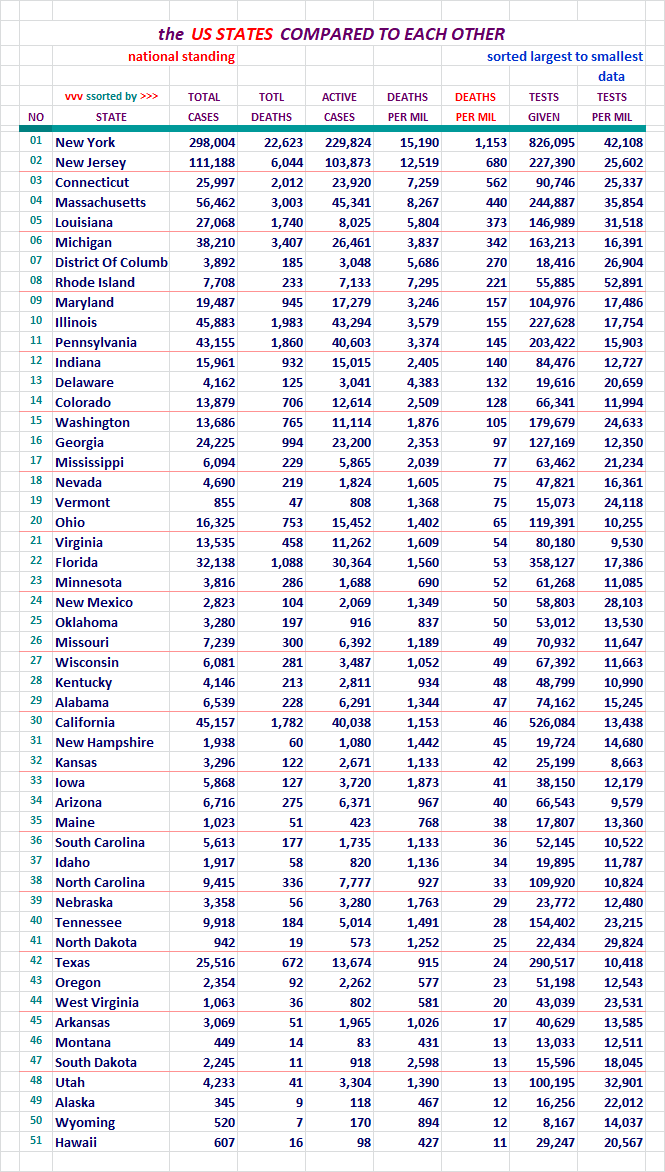
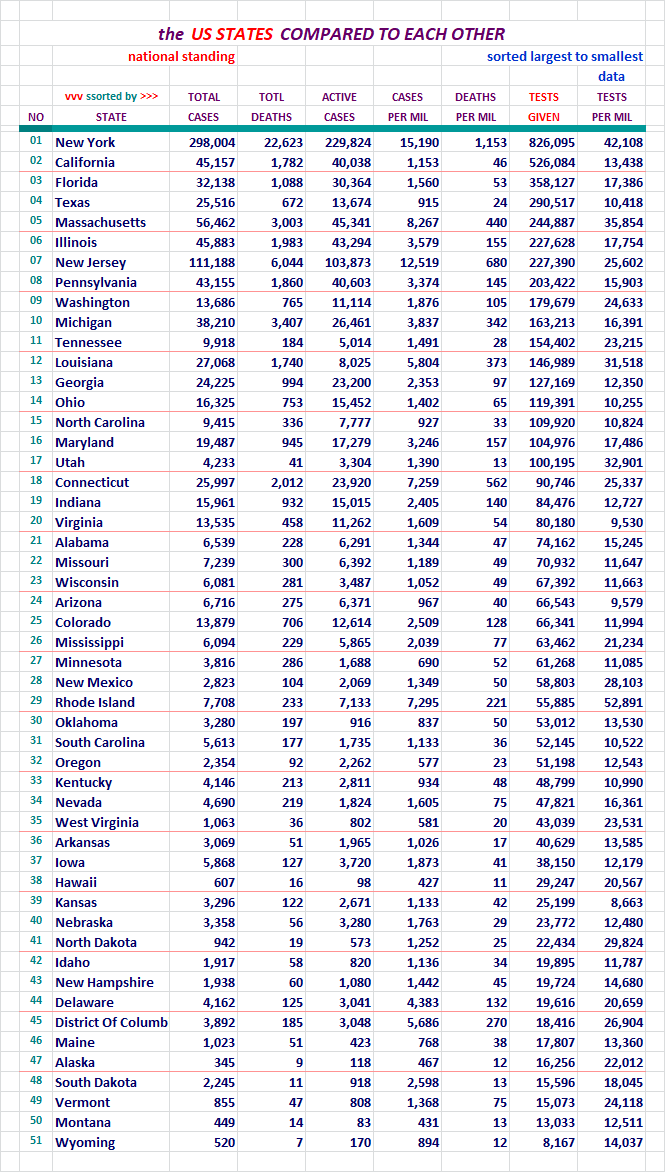
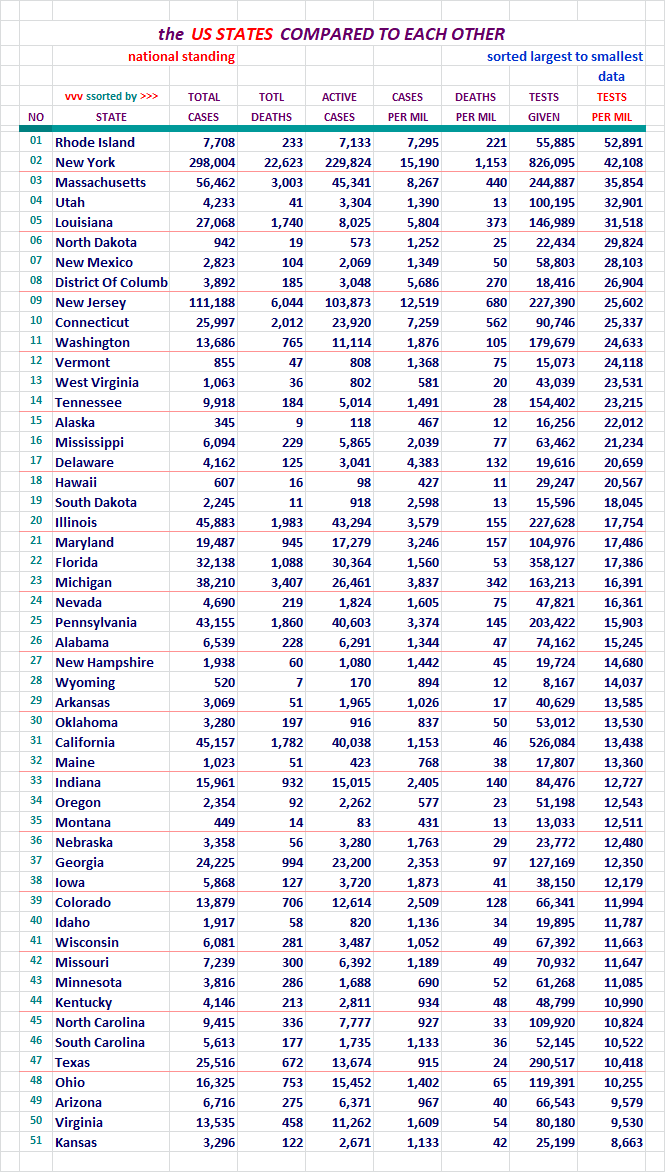
Section: 08
States of the Union and the District of Columbia, Compared to Each Other
Each of these pages is sorted differently. Look at the red header above
the columns to see which column was used for the sort on any given page.
For your review...
For your review...
For your review...
For your review...
For your review...
For your review...
For your review...
For your review...
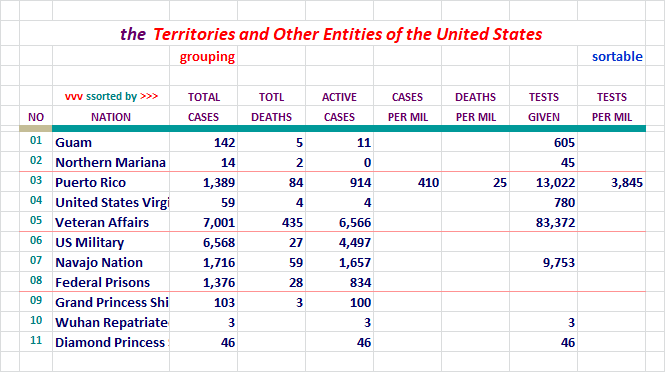
Some interesting figures there for various segments.
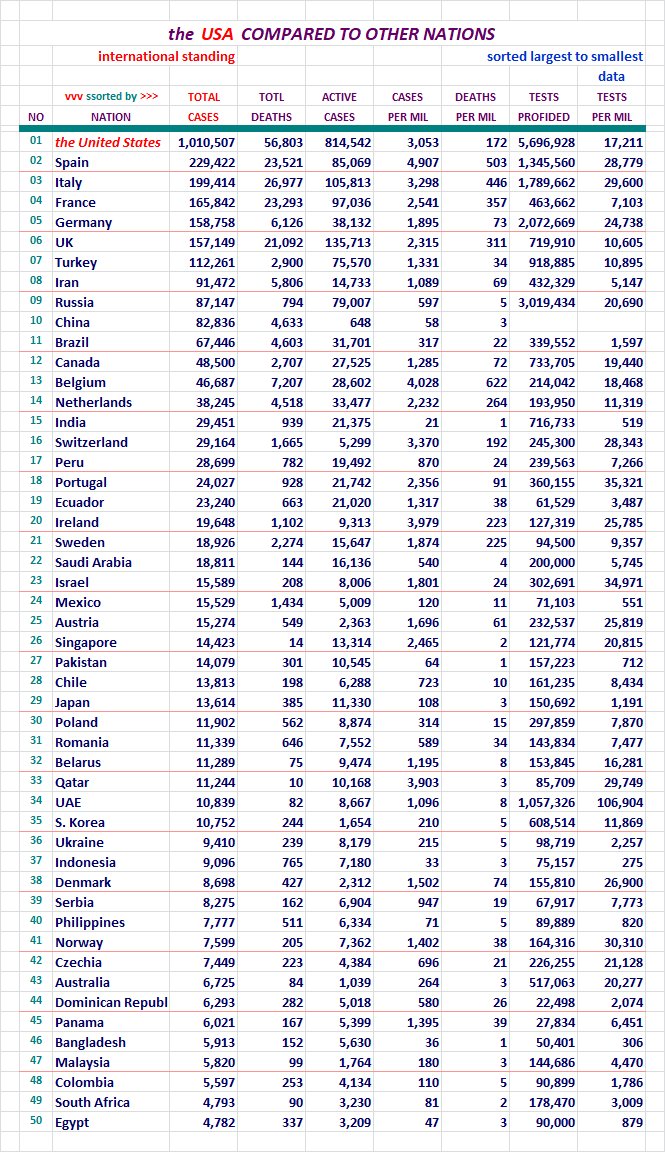
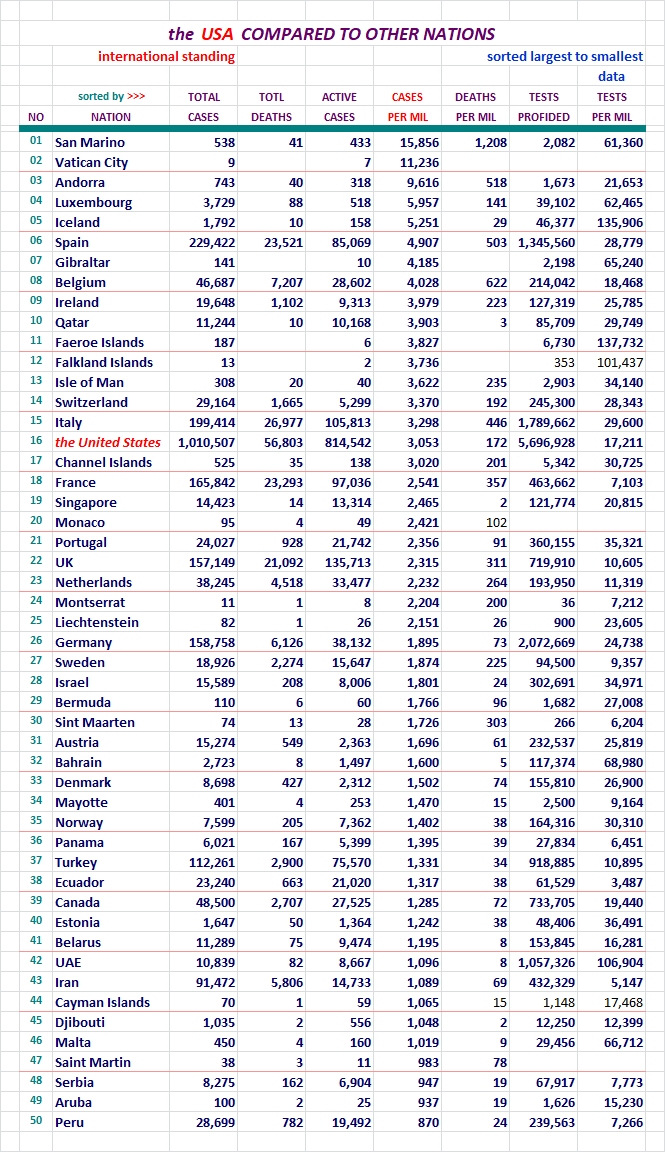
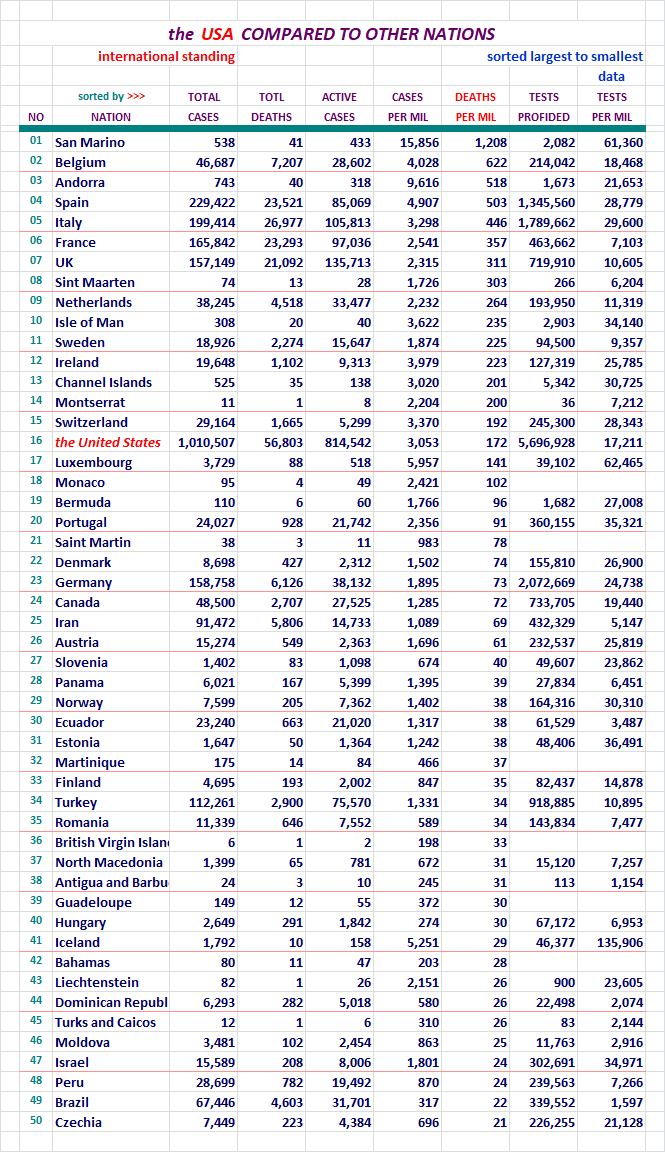
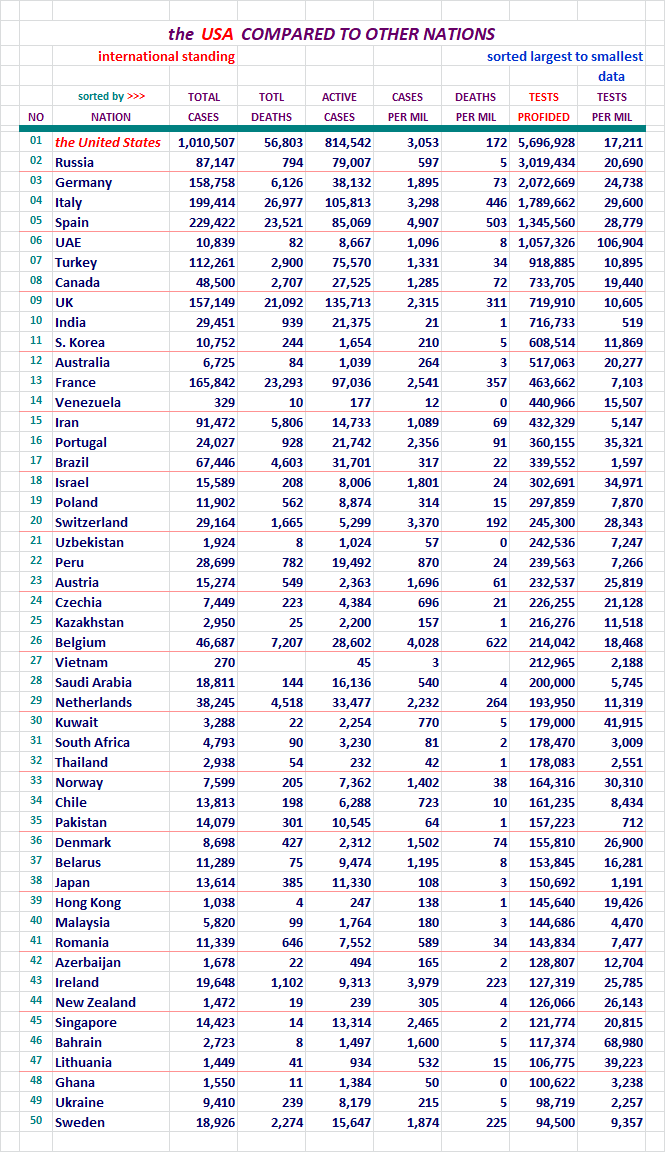
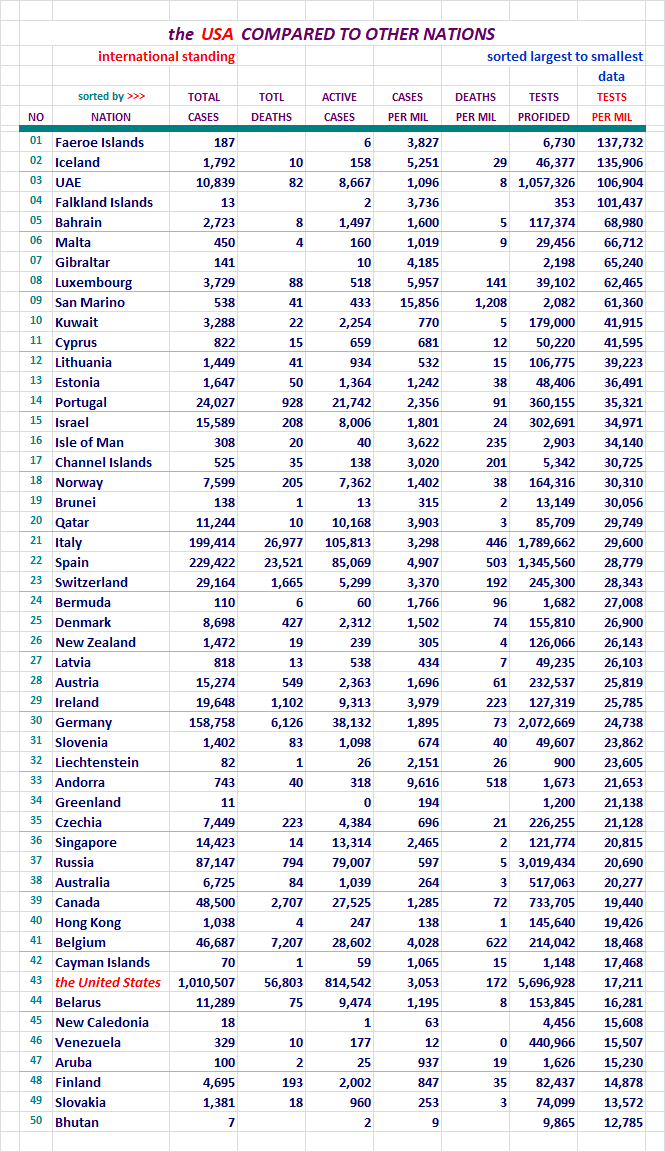
Section: 09
The United States, Where it Ranks With Other Natons?
Each of these pages is sorted differently. Look at the red header above
the columns to see which column was used for the sort on any given page.
The U. S. will be highlighted red here so we can find it easily in the list.
There were 212 nations on this list last night now. I didn't want to post
seven lists with 212 nations on it, so I picked the top 50. Coincidentally,
one report category has the U. S. at 41st, so it wasn't showing up on the
list with 31 top spots on it. That wasn't the reason why I extended the
list length, but it did work out well.
I work on the nations right next to the states on my spreadsheet. The
states with the Disctrict of Columbia come in at a total of 51 lines.
I decided to keep the international reports near that length, and 50
was good enough.
Here we go... for your review.
For your review...
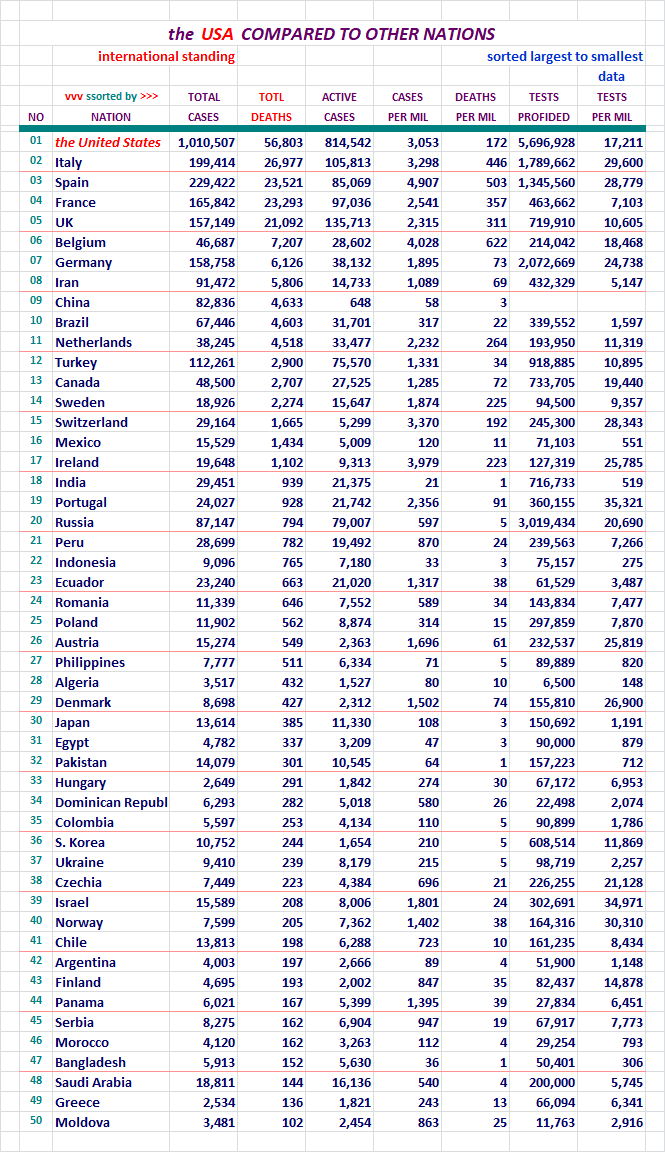
For your review...
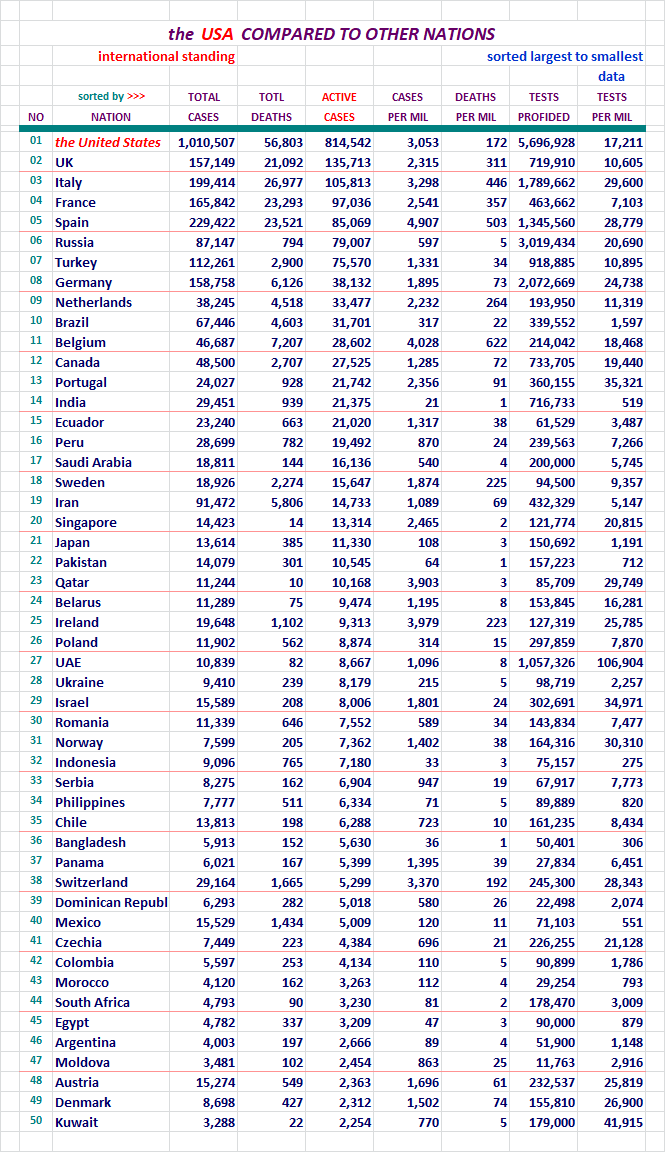
For your review...
For your review...
For your review...
For your review...
For your review...
This is our highest positioning yet. We were 42nd a few days ago.
Section: 10
Here's what it's all about. From January 20th to the present.
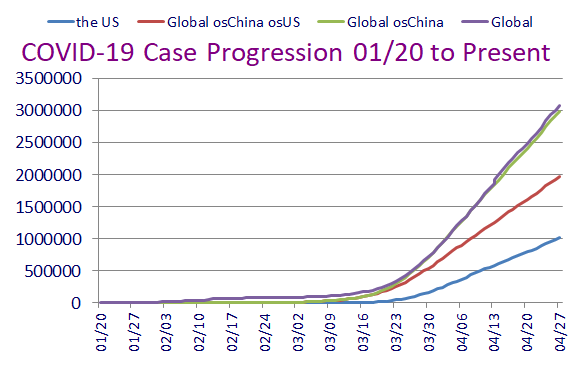
This concludes our look back at yesterday's data. Take care...

Section: 11
Data for this Report Sourced From:
LINK Johns Hopkins University
The Center for Systems Science and Engineering (CSSE)
LINK WorldoMeters
LINK You are Invited to Review My COVID-19 Spreadsheet (XLSX)
There is not an XLS version available for distribution at this time.
Section: 12
Other Features:
LINK US Counties200, States & DC51, Territories, & Other Entities11, and Nations212
Four Excel Spreadsheet datasets you can sort for your own studies...
Section: 13
Links to other resources:
I cannot vouch for these sites. Please use your own discression.
LINK Adventist Health Coronavirus Resource Hub - Scroll down for useful info
LINK CDC Data for Download - Scroll down - Excel required. Includes death stats.
LINK CDC Secondary Data and Statistics - Portal Entry / Look around
LINK Coronavirus (COVID-19) Map
LINK COVID-19 First U.S. Case, Treatment, features Remdesivir
New England Journal of Medicine article
LINK Cytokine Storm, med Actemra, Physician near death saved
LINK Diamond Princess Review at 634 Case Point of Eventual 712
LINK earlyAlert
LINK Hydroxychloroquine Article: International Poll
Daily Mail Reports, Most Effective Treatment According to 6,000 Physicians
LINK IHME - Institute for Health Matrix and Evaluation
LINK National Institutes of Health - Cornavirus (COVID-19)
LINK Nazal Irrigation is the Key, COVID-19 Related
LINK New York City - interesting breakdown, burough, age, sex
LINK On the Origin of CCP Virus, A Documentary Movie (turn up the sound)
Epoch Times: I highly recommend this very well documented report.
LINK World Health Organization

Are people being “suicided” who threaten to speak out?
https://www.citizenfreepress.com/column-1/nyc-nurse-whistleblower-speaks-out/
There are things that concern me about how the elderly
are being treated during this epidemic.
On Wednesday April 1 I began tracking the number of ‘serious, critical’ cases being reported in the USA.
These are the people who may likely die in the next few days.
If the ‘serious, critical’ number goes up, we will likely see more deaths. On the other hand if the various drugs being tested are effective in treating the virus, the ‘serious, critical’ number should go down.
Here are the numbers:
Apr 14 Tue 13473
Apr 15 Wed 13487
Apr 16 Thu 13369
Apr 17 Fri 13509
Apr 18 Sat 13551
Apr 19 Sun 13566
Apr 20 Mon 13951
Apr 21 Tue 14016
Apr 22 Wed 14016
Apr 23 Thu 14997
Apr 24 Fri 15097
Apr 25 Sat 15110
Apr 26 Sun 15143
Apr 27 Mon 14186
Last week we had a 500 patient jump on Monday . And Thursday we had a 1000 patient increase. Yesterday, we had a 1000 patient decline in the number of patients critical/serious.
I looked at the worldometer website to see how they collect the serious/critical data: “Today, it represents for the most part the number of patients currently being treated in Intensive Care Unit (ICU), if and when this figure is reported.”
What we need to see is a slowdown in the number of people who are serious/critical and a slowdown in the number of people dying. Yesterday, both happened. Let us hope as the week progresses, both continue to decline.
I also truncated the data to keep this posting shorter. Earlier numbers are available in DoughtyOne’s tables.
They were on Laura Ingram last night for a few minutes and were very interesting.
Before the hour was over, you tube dumped the videos and banned them from future viewing.
That is one way to stop critics.
Not very relevant how Sweden compares to the Latin countries.
How does it compare against the countries that are most like them, the Nordic countries?
Specifically Norway and Finland.
Denmark is also Nordic and Scandinavian but much more population dense. Ethnically, population density and rates of medical comorbidities much more align with Norway.Finland is very similar but not Scandinavian.
YouTube, Facebook, and twatter are all banning people and removing info that doesn’t toe the Fauxi line.

Everything being done falls on one side of the ledger or the other as described below. Big tech has thrown in completely with the one world crowd.
What should be clear is that there are two pandemics. The VIRAL pandemic and the POLITICAL pandemic. The purpose of the political pandemic is to permanently rearrange the sources of power and control over many populations. A consequence of this is to dismember the brief but successful experiment in individual liberty and natural rights begun with the Enlightenment and Western liberalism. For this end America must die.
Like two ancient Titans, the opponents face off and use any and all events to advance their agendas. On the left, the number of participants are enormous, the list goes on and on. On the right, you can pretty much count the number of knights on one hand.
CDC CORONA VIRUS TESTING DATA
Today is Tuesday, April 28th and the most recent data posted by the CDC on corona virus testing is for the week ending April 18th.
https://www.cdc.gov/coronavirus/2019-ncov/covid-data/covidview/index.html
It must be the pits for Vice President Pence to have to rely upon Worldometer for data on testing in the USA. At yesterday’s press conference VP Pence said that 5.4 million tests had been done in the USA. Worldometer numbers for Sunday were 5,470,464.
Meanwhile, the CDC website is saying that total tests as of April 18 is 3,164,787. And to add further insult, the CDC posts this disclaimer on testing: “””Commercial and clinical laboratory data represents select laboratories and does not capture all tests performed in the United States.”””
Think about what is happening here folks.
From what I understand, Worldometer is a basically VOLUNTEER run organization that is able to collect data from countries throughout the world and publish that data on a minute by minute basis each and every day.
Meanwhile, the overpaid and incompetent bureaucrats that Trump inherited at the CDC cannot even collect the data much less publish the data within a reasonable time frame.
I’ve been following their numbers for the past 2 weeks. If you look at the numbers, Sweden is twice as bad (a little more actually) as the other Nordic countries. Finland has the best numbers, then Norway, then Denmark, & Sweden is last.
bttt

Does it show that a "second wave" has already come and gone ending 4/25?
What it shows more to me, is the Thursday - Friday reporting
zenith compared to the Sunday - Monday lack of information
reported.

Disclaimer: Opinions posted on Free Republic are those of the individual posters and do not necessarily represent the opinion of Free Republic or its management. All materials posted herein are protected by copyright law and the exemption for fair use of copyrighted works.