
Posted on 04/10/2020 2:46:20 AM PDT by DoughtyOne
PING LIST
Some of you have asked to be placed on the COVID-19 Update Ping List. Those who give me a
request, will be placed on the list before the next Update is posted.
If a person has expressed an appreciation for the data I'm presenting, I may add that
person to the Ping List.
Some folks don't like to be on ping lists, and I won't mind if you would rather I remove your name
from the list.
COVID-19 Update
As of 04/09/2020 23:19 PDST (taken at 23:59)
Good morning everyone.
Thank you for stopping by to check out this Update.
Be on the Lookout for Somethings New:
A Few Graphs, and Workups on States, Territories, & Counties
Links to other resources: Near the bottom of this post.
Commentary2: Interesting Tid-bits (hopefully)
Yesterday Morning...
Yesterday morning I had a production problem getting the update out. You can skip
this part if you want. It does explain how the numbers yesterday were skewed a bit.
I wanted you to be able to understand what took place, but it may just bore some of
you. It's up to you. I offer it here as an apology for not being quite a judicious
as I should have been.
In preparation for publishing my early morning COVID-19 Update, I spend from roughly
seven in the evening until midnight pre-building the graphis structure that will become
the update. During this period last night I became aware of a potential problem.
I had run my next to last report of the day, which is simply a capturing of data off the
JHU map daily resource online, at about 18:30. At about 19:30 I touched base with the site
again just to check in what direction the numbers were leading. I do that so I can get a
rough idea of the type of commentary I'll be providing. Are things calming, heating up, or
is there something interesting to mention?
When I checked in, there seemed to be a problem with the site. The documentation on the site
indicated there had been an update since I had recorded things an hour earlier, but all the
numbers had gone down noticably since the earlier report. Numbers don't shrink. They grow.
If this wasn't resolved in the next 4.5 hours, I would have some serious problems not only
capturing a meaningful end of day report, but then getting out my update to you. I was
concerned.
As the time passed midnight yesterday morning, there had been no resolution to the problem.
The JHU site was useless to me. In anticipation of this, I had devised a backup plan using
WorldoMeters data. That sounds like a good back-up plan. Well, in theory it was, but...
I just ran another report for today. It will be my last before the end of the day report
today. Because I have automated my system to work with JHU data, I can copy and
paste in data and process it quickly. It took me 12 minutes to update all necessary
changes to the 210 nations I monitor for each report. During that twelve minutes I also
grab data for Global, Global Outside China, and the United States. Last night
implementing the back-up plan using WorldoMeters' informaiton, it took an hour and
fifteen minutes.
The problems are, the data is in a different format. JHU and WoM each of a few nations
the other one doesn't. And using the raw data from WoM causes me to have to devise new
methods on the fly, to get things done. I have to conceptualize the whole thing planning
in advance how each step in the process will go, and how to prevent having to start all
over if something goes wrong. It's very draining.
Last night I finally pulled off getting the last report documented. And then I spent
a few more hours writing, completing graphics, and proof reading and polishing off the
materials as well as I could.
By the end of last night, I was pretty tired. For that reason, several things didn't
come to mind as I wrapped up the enterprise.
These two data providers do not match up 100%. At any given time either of them can
be farther ahead in processing data, which means their numbers can be larger of smaller
than the other sourse. Last night that margin came out to be about 4,000 caseas.
This means that the totals of cases for the day were bumped up. It also means that
numbers for deaths and recoveries were probably elevated also.
That being the case, I should have modified some of my commentary to acknowedge the
dynamic and how it might impact numbers. By the time I was done, I was just trying to
get it out, so I didn't quite complete my job, letting you know about this dynamic. I
am sorry about that. It's not my intent to present misleading data or concepts to you.
Providing complete data is not a problem, because the next day that data would have
been documented and present to you anyway. The thing is, it can skew the numbers of cases
for the day, and that did happen.
I have seen JHU data problems, and I have seen WoM data problems. The other day WoM
had 346,000 U. S. cases documented. I had been in tune with the JHU data, and I was
pretty sure that was about 20,000 cases high. Sure enough, about ten minutes later the
number was corrected downward about 20,000 case, and the grand total had been reduced
by the same amount on WoM.
These places do the best they can. Humans being humans, there are times when
inconsistancies will pop up. They will be corrected. That's life.
Today I am back to using JHU data. What caused our counts to go up yesterday, MAY cause
them to go down today. Keep this in mind as you look at the number. Thanks.
I just want you to know that I try to put out a decent product, and I will try not
to let that happen again. I am develping an automated process for WoM data, so that if
something happens again. It won't impact my process so much. And, if this should happen
again, I'll be sure to keep you informed. Thanks.
Sorry for the miniature book. I just wanted you to be able to fully understand what
took place.
The Inevitabe Counter Attack of the Recovering Humans Continues
Over the last few weeks, I've been watch one favorable thing headed in our direction.
It was the idea that shortly the percentage of global cases that had been resolved
would be growing.
When the counts reaching their largest rate of grown the percentage of cases revolved
continued to plumet. There hadn't been enough people in the pipeline to see a lot
of recoveries. Well, those days have come to an end.
The percentage of resolved cases was stalling in the upper 25.50% range for about a week.
prior to that it had been falling at least a percent per day. Now it rests at 28.153%
and is growing about 0.50% to 0.75% per day.
This does not mean that the number of new cases is going to go down right now. It just means
that we are now poised to fight back in larger numbers as our people are declared recovered.
It's very good news.
The Following Addresses the Numbers Here in
the United States of America
Yesterday's Growth Rate Kept Up the Customary Growth
Declared Cases in the United States
             EOD    DAY'S  INCR'SD
DATE       CASES    GRWTH   GROWTH
-
03/20     19,624    5,374      539
03/21     26,747    7,123    1,749
03/22     35,206    8,459    1,336
03/23     46,442   11,236    2,777
03/24     54,893    8,789   -2,427
03/25     60,197   13,966    5,177
03/26     85,991   16,794    2,828
03/27    104,839   18,848    2,054
03/28    124,665   19,826      978
03/29    143,025   18,360   -1,466
03/30    164,620   21,595    3,235
03/31    189,624   25,004    3,409
04/01    216,721   27,097    2,093
04/02    245,559   28,838    1,741
04/03    278,458   32,899    4,061
04/04    312,237   33,779      899
04/05    337,638   25,401   -8,378
04/06    368,376   30,738    5,337
04/07    399,929   31,553      815
04/08    435,160   35,231    3,678
04/09    466,299   31,139   -4,092
Our number of new cases fit right in with recent growth. I believe some of the numbers from
Fatalities, Recoveries, Resolved, & Serious/Critical Cases
in the United States
                                               ACTIVE     SERIOUS
DATE       FATAL       RECOV      RESOLV        CASES    CRITICAL
-
03/20        252         152         404       19,220
03/21        329         176         505       26,242
03/22        396         178         574       34,632
03/23        428         178         606       45,836
03/24        581         354         935       54,296
03/25        753         619       1,372       67,825
03/26      1,301       1,868       3,169       82,822
03/27      1,704       2,622       4,326      100,513
03/28      2,229       3,231       5,460      119,205
03/29      2,488       4,562       7,050      135,975
03/30      3,170       5,507       8,677      155,943
03/31      4,055       7,251      11,306      178,318
04/01      5,112       8,878      13,990      202,731       5,005
04/02      6,095      10,403      16,498      229,061       5,421
04/03      7,403      12,283      19,686      258,772       5,787
04/04      8,454      14,825      23,279      288,958       5,870
04/05      9,620      17,977      27,597      310,041       8,702
04/06     10,943      19,810      30,753      337,623       8,983
04/07     12,875      22,711      34,586      365,343       9,169
04/08     14,797      22,891      37,688      397,472       9,279
04/09     16,691      25,928      42,619      423,680      10,011
The numbers continue to grow. 42,619 people have come through COVID-19 alive now, in the.
Our Slice of the COVID-19 Pie Continues to Grow
There are a number of factors than can have impact on why we have so many of the global
cases. Perhaps we're ramping up the testing more than others.
Here is what those numbers looked like at the end of the day yesterday. Maybe the virus
was here a lot earlier than we thought. It's hard to know.
       DECLARED     DAY'S     ACTIVE     DAY'S
DATE      CASES      CHGE      CASES      CHGE
-
03/20    7.125%    1.297%    10.934%    1.552%
03/21    8.704%    1.579%    13.000%    2.066%
03/22   10.377%    1.673%    15.343%    2.343%
03/23   12.170%    1.793%    17.411%    2.068%
03/24   13.053%    0.883%    18.369%    0.958%
03/25   14.657%    1.604%    20.190%    1.821%
03/26   16.140%    1.483%    21.454%    1.264%
03/27   17.530%    1.390%    22.920%    1.466%.
03/28   18.742%    1.212%    24.126%    1.206%
03/29   19.762%    1.020%    25.289%    1.163%
03/30   20.936%    1.174%    26.777%    1.488%
03/31   22.045%    1.109%    27.885%    1.108%
04/01   23.110%    1.065%    29.120%    1.235%
04/02   24.160%    1.050%    30.482%    1.362%
04/03   24.886%    0.726%    31.057%    0.575%
04/04   25.935%    1.049%    32.400%    1.343%
04/05   26.464%    0.529%    32.866%    0.466%
04/06   27.324%    0.860%    34.153%    1.287%
04/07   27.930%    0.606%    34.854%    0.701%
04/08   28.634%    0.704%    36.125%    1.271%
04/09   29.091%    0.457%    36.790%    0.665%
The Following Addresses the Global Numbers
without Mainland China
Global Cases Increased to Record Levels Today, Outside M/L China
Yes, back to still more numbers...
               EOD      DAY'S   INCR'SD
DATE         CASES     GROWTH    GROWTH - compared to day before
-
03/20      194,148     30,824     5,185
03/21      225,932     31,784       963
03/22      257,820     31,888       104
03/23      297,172     39,352     7,464
03/24      341,530     41,462     2,110
03/25      390,378     48,848     7,386
03/26      451,006     60,628    11,780
03/27      516,124     65,118     4,490
03/28      583,107     66,983     1,865
03/29      641,588     58,481    -8,502
03/30      704,051     62,463     3,982
03/31      777,887     73,836    11,373
04/01      855,389     77,502     3,666
04/02      933,937     78,548     1,046
04/03    1,036,395    102,458    23,910
04/04    1,121,349     84,954   -17,054
04/05    1,193.215     71,866   -13,088
04/06    1,265,487     72,272       386
04/07    1,349,117     83,630    11,358
04/08    1,436,669     87,552     3,922
04/09    1,519,961     83,292    -4,260
I know that's a big number, but in the over scheme of things, that number is pretty small
Cases continue to go up, but the growth has flattened.
Fatalities, Recoveries, Resolved, Active, and Serious/Crical Cases
Globally, Excluding M/L China
                                               ACTIVE     SERIOUS
DATE       FATAL       RECOV      RESOLV        CASES    CRITICAL
-
03/20      8,110      16,393      24,503      169,645
03/21      9,740      19,995      29,735      196,197
03/22     11,305      25,485      36,790      221,030
03/23     13,060      28,470      41,530      258,538
03/24     15,347      35,256      50,603      290,927
03/25     17,643      40,467      58,210      332,168
03/26     20,785      48,084      68,869      382,137
03/27     24,466      56,801      81,267      434,857
03/28     27,522      64,777      92,299      490,808
03/29     30,714      76,342     107,056      534,532
03/30     34,515      89,989     124,504      579,547
03/31     39,052     102,121     141,163      636,724
04/01     43,949     118,092     162,041      693,348
04/02     49,838     135,204     185,042      748,895
04/03     55,611     150,014     205,625      839,770
04/04     61,466     170,309     231,775      889,574      41,993
04/05     66,183     185,921     252,104      941,111      45,633
04/06     71,485     208,635     280,120      985,367      47,201
04/07     78,812     224,264     303,076    1,046,041      47,743
04/08     85,214     253,546     338,760    1,097,909      47,990
04/09     92,409     278,059     370,468    1,149,493      49,001
There were 31,708 resolved cases today. It's hard to believe the recovered people numberThat's a lot of people. Next on tap, watch the recoveries over the next week. It will
be impressive.
Flattening...
There is flattening going on in the Global scene outside China and the U. S. Right now.
Lets review the situation again.
Here: (case growth)
-
         Global    Global (EC)
      Excluding          Minus             the
          China      the U. S.           U. S.
03/29    58,481         38,955          19,826
03/30    62,463         40,868          21,595
03/31    73,836         48,832          25,004
04/01    77,502         50,405          27,097
04/02    78,548         49,710          28,838
04/03   102,458         69,559          32,899
04/04    84,954         51,111          33,843
04/05    71,866         46,465          25,401
04/06    72,272         41,534          30,738
04/07    83,630         52,077          31,553
04/08    87,552         52,321          35,231
04/09    83,292         52,153          31,139

Look at those numbers three days in a row. That center column is the rest of the world
without China and the U. S. impacting them. Only 244 points spread there. Am I safe in
saying that's sort of flat?
Special Section on France, Germany, Italy, and Spain
Case growth.
Lets Look at Some Numbers in Five Day Increments:
DATE       FRANCE      GERMANY        ITALY       SPAIN
-
02/20          12           16            3           2
02/25          14           18          322           9
03/01         100          117        1,128          76
03/06  --     653  --      670  --    4,636  --     401
03/11       2,284        1,966       12,462       2,277
03/16       6,650        7,272       27,980       9,942
03/21      14,485       22,364       53,578      25,496
03/26  --  29,566  --   43,938  --   80,589  --  57,786
03/31      52,819       68,180      105,792      94,417
04/05      93,780      100,123      128,948     131,646
04/09     118,785      118,235      143,626     153,222

Just keeping an eye on these nations. France and Germany are neck and neck there.
Sweden and It's Neighbors, Who Has the Best Tactic Againt COVID-19
Sweeden is doing their own thing with regard to isolating. I'm cheking out if they
are doing the right thing or not. I'm not convinced either way at this point.
Here are some numbers to help us look at this issue.
DATE       SWEDEN      DENMARK      FINLAND      NORWAY
-
02/21           1            0            1           0
02/26           2            0            1           1
03/02          15            4            6          25
03/07  --     161  --       27  --       19  --     156
03/12         599          617           59         702
03/17       1,196        1,024          321       1,471
03/22       1,934        1,514          626       2,385
03/27  --   3,069  --    2,700  --    1,041  --   3,771
04/01       4,947        3,290        1,446       4,877
04/06       7,206        4,875        2,176       5,865
04/09       9,141        5,830        2,605       6,219 > 3 days not five
-
Deaths        793          237           42         108
-
Populace    10.33m        5.82m        5.53m       5.37m

I'll keep an eye on these nations and add to the above numbers daily.
The Following Addresses the Global Numbers
including Mainland China*
Mainland China numbers make up 00.19% of today's cases globally
Nations With Lots of Cases
At the end of the day on 04/07/2020, there were: Oops, at 19:33 PDST last night...
 1 nation(s) with 400,000 plus (take a bow...)
 4 nation(s) with 100,000 to 199,999
 3 nation(s) with  50,000 to  99,999
 5 natiom(s) with  20,000 to  49,999
 5 nation(s) with  10,000 to  19,999
13 nation(s) with   5,000 to   9,999
33 nation(s) with   1,000 to   4,999
There are currently 64 nations with a 1,000 count or above...
A Look at Declared, Resolved, and Active Cases, Includes M/L China
End of day figures follow:
           DECLAR     DAY'S  RESOLVED    DAY'S   PCT DEC      ACTIVE
DATE        CASES    GROWTH     CASES   GROWTH  CS RESOL       CASES
-
03/20 -   275,434 -  30,911 -  99,655 -  3,590 - 36.181% -   175,779
03/21     307,280    31,846   105,425    5,770   34.309%     201,855
03/22     339,259    31,979   113,540    8,115   33.467%     225,719
03/23 -   381,621 -  42,362 - 118,369 -  4,829 - 31.017% -   263,252
03/24     423,121    41,500   127,538    9,169   30.142%     295,583
03/25     472,109    48,998   136,178    8,640   28.845%     335,931
03/26 -   532,788 -  60.679 - 146,749 - 10,571 - 27.544% -   386,039
03/27     598,070    65,282   159,533   12,784   26.675%     438,537
03/28     665,164    67,094   171,077   11,544   25.720%     494,087
03/29 -   723,740 -  58,576 - 186,060 - 14,983 - 25.708% -   537,680
03/30     786,291    62,551   203,926   17,848   25.933%     582,383
03/31     860,181    73,890   220,713   16,085   25.659%     639,468
04/01 -   937,783 -  77,602 - 241,591 - 20,878 - 25.762% -   696,192
04/02   1,016,401    78,618   264,935   23,344   26.066%     751,466
04/03   1,118,921   102,520   285,706   20,771   25.534%     833,215
04/04 - 1,203,923 -  85,002 - 312,068 - 26,362 - 25.931% -   891,855
04/05   1,275,856    71,933   332,513   20,445   26.062%     943,343
04/06   1,348,184    72,328   359,618   27,105   26.674%     988,566
04/07 - 1,431,900 -  83,716 - 383,688 - 24,070 - 26.796% - 1,048,212
04/08   1,519,478    87,848   419,465   35,777   27.606%   1,100,283
04/09   1,602,885    83,407   451,259   31,794   28.153%   1,151,626
Although there were 83,407 new cases declared today, the actual growth in new casesThe percentage of resolved cases is climbing pretty good now. As mentioned earlier,
those numbers are going to get very large in upcoming days. Expect 50, 60, perhaps
70 thousand per day shortly. We're talking tomorrow or perhaps another day or two.
Fatalities, Recoveries, Resolved, Active, and Serious/Crical Cases
Globally, Including M/L China
                                               ACTIVE     SERIOUS
DATE       FATAL       RECOV      RESOLV        CASES    CRITICAL
-
03/20     11,399      88,256      99,655      175,779
03/21     13,049      92,376     105,425      201,855
03/22     14,706      98,834     113,540      225,719
03/23     16,563     101,806     118,369      263,252
03/24     18,919     108,619     127,358      295,583
03/25     21,308     114,870     136,178      335,931
03/26     24,077     122,672     146,749      386,039
03/27     27,761     131,772     159,533      438,537
03/28     30,852     140,225     171,077      494,087
03/29     34,018     152,042     186,060      537,680
03/30     37,820     166,088     203,908      582,383
03/31     42,354     178,359     220,713      639,468
04/01     47,261     194,330     241,591      696,192
04/02     53,160     211,775     264,935      751,466
04/03     58,937     226,769     285,706      833,215
04/04     64,795     247,273     312,068      891,855      42,288  ch 295
04/05     69,514     262,999     332,513      943,343      45,898  ch 265
04/06     74,816     284,802     359,618      988,566      47,412  ch 211
04/07     82,145     301,543     383,688    1,048,212      47,932  ch 189
04/08     88,549     330,916     419,464    1,100,283      48,166  ch 176
04/09     95,475     355,514     451,259    1,151,626      49,145  ch 144
Not much to say about these numbers, I haven't said elsewhere. I'll spare you.
Population Saturation
Here are figures revealing how many people in each population base represent one case.
I'm also showing what percent of each population base is infected at this time.
                     1 CASE IN
                   THIS NUMBER
                     OF PEOPLE
ENTITY                   04/09       04/08       04/07       04/09       04/08
-
Globally      :          6,747       7,062       7,413        -315        -351
Outside China :          6,760       7,077       7,428        -317        -351
The U. S. A.  :            780         831         904         -51         -73
-
               INFECTION LEVEL
                     OF ENTIRE
                      POPULACE
ENTITY                   04/09       04/08       04/07       04/09       04/08
-
Globally      :       00.0141%    00.0134%    00.0127%    00.0007%    00.0007%
Outside China :       00.0180%    00.0172%    00.0164%    00.0008%    00.0008%
The U. S. A.  :       00.1282%    00.1203%    00.1106%    00.0079%    00.0938%
These saturation rates are troubling. The percentge of our populace infected is too,
States of the Union, the District of Columbia, and Territories...
I still have this available in the Excel format, linked below. I thought folks might
like to have access to it here. I list the states alphabetically. On the right side
of that listing is the ranking number in the list by descending cases. Look up your
state alphabetiall, get that number, and look at the list on the right to find look
at how the other states stand next to yours.

Here is the Standing of 200 Counties in the U. S.
I still have this available in the Excel format, linked below. I thought folks might
like to have access to it here. I list the Counties alphabetically. On the right
side of that listing is the ranking number in the list by descending cases. You can
look to see if your county is listed. Hopefully not... If you find it, you can look
at the numberical list to compare to other counties.

Here's what it's all about. From January 20th to the present.

This concludes our look back at yesterday's data. Take care...
Data for this Report Sourced From:
LINK Johns Hopkins University
The Center for Systems Science and Engineering (CSSE)
LINK WorldoMeters
LINK You are Invited to Review My COVID-19 Spreadsheet (XLSX)
There is not an XLS version available for distribution at this time.
Other Features:
LINK US States DC51, Territories5+, and Counties200
Excel Spreadsheet with Alphabetical and Numerically descending Cases
Links to other resources:
I cannot vouch for these sites. Please use your own discression.
LINK Adventist Health Coronavirus Resource Hub - Scroll down for useful info
LINK CDC Secondary Data and Statistics - Portal Entry / Look around
LINK Coronavirus (COVID-19) Map
LINK COVID-19 First U.S. Case, Treatment, features Remdesivir
New England Journal of Medicine article
LINK Diamond Princess Review at 634 Case Point of Eventual 712
LINK earlyAlert
LINK Hydroxychloroquine Article: International Poll
Daily Mail Reports, Most Effective Treatment According to 6,000 Physicians
LINK IHME - Institute for Health Matrix and Evaluation
LINK National Institutes of Health - Cornavirus (COVID-19)
LINK New York City - interesting breakdown, burough, age, sex
LINK World Health Organization
Here’s something new. As best as i can tell there’s only one reference on the entire web about Erythropoietin as a treatment for COVID-19, and it was posted on April 8.
https://onlinelibrary.wiley.com/doi/abs/10.1002/jmv.25839

makes sense....hope it is studied more down the road.
Please add me to the Ping List.
The mark of a great analyst is that they have an intuitive sixth sense when the data goes wonky. They pause and look instead of just plug and play. That and nothing is more frustrating than having your macro fouled by having a formatting change in an outside data set.
Your product isn't decent - it's FANTASTIC.
All these numbers are provisional, they are compiled in the field by people under ferocious time pressure, personal fear, and political interference.
You are familiar with the term "the fog of war". That's what you are dealing with trying to quantify an in-motion disaster like this.
Keep up the good work. We really appreciate it.
Wonder what Finland is doing to keep their numbers so low?
Please add me to the ping list.
Dr. Seheult on the MedCram youtube channel speculates that it may have something to do with sauna use boosting the Finns innate immune system. More common in Finland than the other countries of the region.
Your work is FANTASTIC!!!!!!
The excerpt below is particularly interesting and I would believe that the higher US numbers may be related to our better bookkeeping on the data.
>>>>>>>>>>>>>>>>>>>>>>>>>>>>>>>>>>>>>>>>>>>>>>>>>>>>>>>>>>>>
INFECTION LEVEL
OF ENTIRE
POPULACE
ENTITY 04/09 04/08 04/07 04/09 04/08
-
Globally : 00.0141% 00.0134% 00.0127% 00.0007% 00.0007%
Outside China : 00.0180% 00.0172% 00.0164% 00.0008% 00.0008%
The U. S. A. : 00.1282% 00.1203% 00.1106% 00.0079% 00.0938%
These saturation rates are troubling. The percentge of our populace infected is too,
when you compare to the global percentage. I guess it’s possible there is a massive
body of people who are not being tested, and that skews us a lot higher by comparison.
Your work is phenomenal. Thank you for posting this every morning. I was curious to know the infection rate for each state, and the USA minus NY. What number are you using for the US population, and are you calculating total cases to date, or active cases? Knowing this will help me with the calculations. Thank you!
The global death rate as compared to global resolved cases(deaths + recovered) including China is still 21 percent.I trust that that number drops as more “recovered” numbers comes in. If you take out China’s numbers the death rate as compared to resolved cases climbs towards 30 percent.
These places do the best they can. Humans being humans, there are times when inconsistancies will pop up. They will be corrected. That's life.
I read an article that NYC's numbers jumped by 800 in one day due to a reporting lag. That's likely not some Deep State plot and it simply screws up day over day comparisons.
I am especially touched by the humanity of this analysis -
Still, every one is an individual we'd rather not see taken by this virus.
Thank you.
On Wednesday April 1 I began tracking the number of ‘serious, critical’ cases being reported in the USA.
These are the people who may likely die in the next few days.
If the ‘serious, critical’ number goes up, we will likely see more deaths. On the other hand if the various drugs being tested are effective in treating the virus, the ‘serious, critical’ number should go down.
Here are the numbers:
Apr 1 Wed 5005
Apr 2 Thu 5421
Apr 3 Fri 5787
Apr 4 Sat 8206
Apr 5 Sun 8702
Apr 6 Mon 8879
Apr 7 Tue 9169
Apr 8 Wed 9279
Apr 9 Thu 10,011
Please add me to the Ping List.
Ping.
By the way, note the chart is a 7-day moving average of new cases for the countries displayed.
A few other items that seem quite obvious to me in this graph. 1) The course of the virus has nothing to do with temperature. It has everything to do with the time needed to run its course. As an example, right now NYC has a temp of 45° -- with a significant slowdown in growth, Montreal, CA has a temp of 36° -- with CA showing a slowdown in growth. These are just two examples. I realize that the temp is only one day, but the point is that generally, the weather in the wide-area is not currently under a heat wave warning and their curve is flattening. 2) It appears from the graph that most all of these countries begin to flatten in 25 to 30 days (some sooner) -- that includes the U.S.
Finally, I am showing the death rate relative to total cases in the U.S. to be slightly above 3%. While, that obviously is not good. There are certainly many who question those numbers. To me even if the numbers are correct that number is not the most important number. The most important number is the number of cases. That seems to be what is closing down our economy. How many lives will we lose from a recession and/or depression? Probably many more than 16,000. As noted in other comments here on FR, the overall death rate (for all causes) for March is down. Where will that number be in August if our economy remains locked down while we remain in our caves?
This chart sure seems to imply, IMO, that we have turned the corner -- as noted in the Italy and Spain headline below. Let's see how long it takes for this news to be heard?
A picture is worth many words.
click on image to enlarge
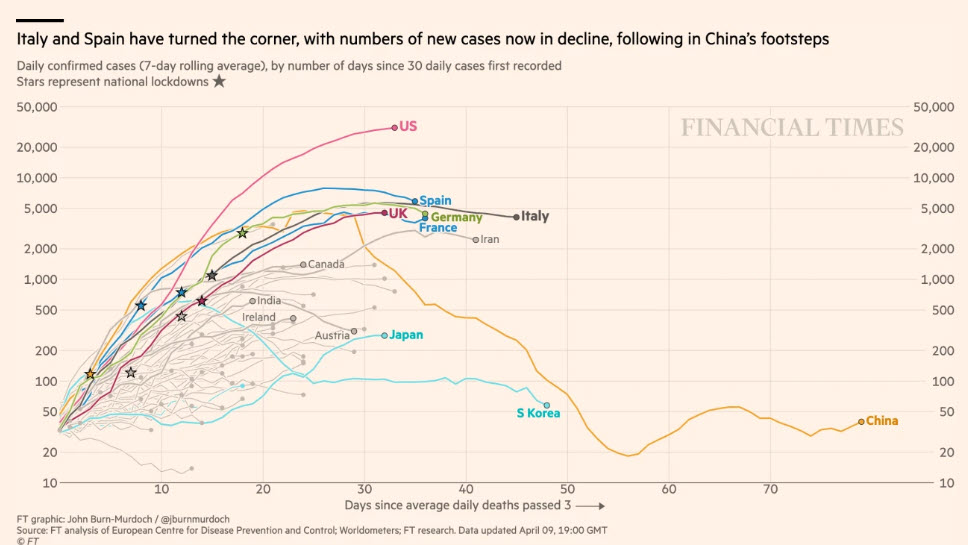
Data from Worldometer & John Hopkins
Thanks for the daily updates. You definitely cast your bread upon the waters, and a veritable feast of data it is. I have a question about a sentence that I think might be a typo:
Disclaimer: Opinions posted on Free Republic are those of the individual posters and do not necessarily represent the opinion of Free Republic or its management. All materials posted herein are protected by copyright law and the exemption for fair use of copyrighted works.