• Pediatric Deaths: 8 [more] influenza-associated pediatric deaths occurring during the 2019-2020 season were reported this week. The total for the season is 144. - https://www.cdc.gov/flu/weekly/index.htm (Retrieved 3-17-20)
Posted on 03/19/2020 6:48:30 AM PDT by daniel1212
Recent data for Covid-19 cases as of 3-19-20 7AM alongside the increased number of tests, plus death rates for the 2017-18 flu (you must do the math).
Below is a list of states per currently reported COVID-19 infections (from Politico via The COVID Tracking Project as of 3-19-20 7:25 AM EDT. CNN reports higher numbers but not the death or testing numbers) in comparison with population size and number of tests. The latter is important since the rate of infections must be compared with the degree of tests in order to determine the rate of trasnmission. Both can be compared with the population size as well as the percent of infections per capita. You use an online calculator such as here but which I have not done.
For Covid, the NYT (3-13) sounded this alarm: “Between 160 million and 214 million people in the U.S. could be infected over the course of the epidemic, according to one projection. That could last months or even over a year, with infections concentrated in shorter periods, staggered across time in different communities, experts said. As many as 200,000 to 1.7 million people could die.” (https://www.nytimes.com/2020/03/13/us/coronavirus-deaths-estimate.html)
Meanwhile, although Covid-19 has hardly competed its run, yet for comparison with the flu we have the morality rate for the flu per state for the 2017-2018 season and total deaths, the latter of which I have provided along side the Covid counts in the table below. Additional stats on the 2019-2020 Flu season are provided below the the table.
During the 2017-2018 season, the percentage of deaths attributed to pneumonia and influenza (P&I) was at or above the epidemic threshold for 16 consecutive weeks. Nationally, mortality attributed to P&I exceeded 10.0% for four consecutive weeks, peaking at 10.8% during the week ending January 20, 2018, (https://www.cdc.gov/flu/about/season/flu-season-2017-2018.htm) with older Americans dying at a rate of 169 Americans a day, or seven people per hour. (https://www.aarp.org/health/conditions-treatments/info-2018/older-flu-deaths-rising.html
And according to a later report by the CDC, for 2017-2018 season 80,000 people died of the flu in U.S, the highest death toll in 40 years. (https://www.usnews.com/news/health-care-news/articles/2018-09-27/cdc-80-000-people-died-of-flu-complications-last-season-in-us)
In any case, I pray that this crisis, both real and inflated, works to bring souls to realize the need for help from above, for repentance and mercy from God through faith in the risen Lord Jesus, thanks be to God for all.
|
State |
Population |
COVID-19 cases |
Percent of infections per capita (you do the math) |
Tests |
Tests increase since last week |
Deaths from COVID-19 (3-18-20) |
Deaths from Flu in 2017-2018 (last available data from CDC) |
|
Washington (27 tied to one nursing home ) |
7,614,893 |
1012 |
|
14129 |
+10726 |
52 |
930 |
|
New York |
19,453,561 |
2382 |
|
14597 |
+14193 |
12 |
4,749 |
|
California |
39,512,223 |
690 |
|
8592 |
+7474 |
13 |
6,917 |
|
Massachusetts |
6,949,503 |
256 |
2,271 |
+2,176 |
0 |
1,441 |
|
|
Colorado |
5,758,736 |
183 |
|
1,800 |
+1,457 |
2 |
568 |
|
Georgia |
10,617,423 |
183 |
|
1,508 |
+1,477 |
1 |
1,530 |
|
Florida |
21,477,737 |
314 |
|
2493 |
+2013 |
7 |
3.091 |
|
Illinois |
12,671,821 |
288 |
|
2052 |
+1,685 |
1 |
2,564 |
|
New Jersey |
8,882,190 |
427 |
|
638 |
+514 |
5 |
1,465 |
|
Texas |
28,995,881 |
83 |
|
1,907 |
+1,884 |
2 |
3,516 |
|
Oregon |
4,217,737 |
75 |
|
1,554 |
+1,187 |
3 |
530 |
|
Pennsylvania |
12,801,989 |
133 |
|
1,320 |
+1,101 |
0 |
2,887 |
|
Iowa |
3,155,070 |
29 |
|
128 |
+23 |
0 |
697 |
|
Louisiana |
4,648,794 |
240 |
|
575 |
+524 |
6 |
824 |
|
Maryland |
6,045,680 |
85 |
|
179 |
+73 |
0 |
973 |
|
North Carolina |
10,488,084 |
63 |
|
1,850 |
+1,778 |
0 |
2,064 |
|
District of Columbia |
705,749 |
39 |
|
|
|
0 |
N/A |
|
Indiana |
6,732,219 |
39 |
|
193 |
+129 |
2 |
1,118 |
|
Nebraska |
1,934,408 |
24 |
|
230 |
+107 |
0 |
394 |
|
South Carolina |
5,148,714 |
60 |
|
643 |
+585 |
1 |
882 |
|
Wisconsin |
5,822,434 |
106 |
|
1,683 |
+1,591 |
0 |
1,075 |
|
Arizona |
7,278,717 |
28 |
|
278 |
+163 |
0 |
1,116 |
|
Virginia |
8,535,519 |
77 |
|
1,278 |
+1,144 |
1 |
1.283 |
|
Kentucky |
4,467,673 |
35 |
|
380 |
+316 |
0 |
969 |
|
South Dakota |
884,659 |
11 |
|
913 |
+867 |
1 |
245 |
|
Nevada |
3,080,156 |
55 |
|
353 |
+178 |
1 |
527 |
|
Tennessee |
6,833,174 |
98 |
|
447 |
+350 |
0 |
1,646 |
|
Minnesota |
5,639,632 |
77 |
|
2,762 |
+2,446 |
0 |
698 |
|
New Hampshire |
1,359,711 |
26 |
|
747 |
+626 |
0 |
265 |
|
Rhode Island |
1,059,361 |
33 |
|
907 |
+800 |
0 |
192 |
|
New Mexico |
2,096,829 |
28 |
|
2,354 |
+2,194 |
0 |
365 |
|
Ohio |
11,689,100 |
77 |
|
551 |
+464 |
0 |
2,395 |
|
Connecticut |
3,565,287 |
68 |
|
193 |
+98 |
0 |
757 |
|
Utah |
3,205,958 |
63 |
|
194 |
+58 |
0 |
353 |
|
Hawaii |
1,415,872 |
14 |
|
119 |
+117 |
0 |
542 |
|
Michigan |
9,986,857 |
80 |
|
355 |
+235 |
0 |
1,869 |
|
Oklahoma |
3,956,971 |
29 |
|
517 |
+474 |
0 |
809 |
|
Vermont |
623,989 |
19 |
|
611 |
+512 |
0 |
87 |
|
Arkansas |
3,017,825 |
33 |
|
319 |
+269 |
0 |
670 |
|
Delaware |
973,764 |
25 |
|
76 |
+35 |
0 |
167 |
|
Kansas |
2,913,314 |
16 |
|
433 |
+388 |
1 |
630 |
|
Mississippi |
2,976,149 |
34 |
|
513 |
+471 |
0 |
910 |
|
Missouri |
6,137,428 |
13 |
|
266 |
+201 |
0 |
1,477 |
|
North Dakota |
762,062 |
6 |
|
274 |
+247 |
0 |
152 |
|
Wyoming |
578,759 |
15 |
|
193 |
+192 |
0 |
128 |
|
Alabama |
4,903,185 |
46 |
|
96 |
+86 |
0 |
1,268 |
|
Idaho |
1,792,065 |
9 |
|
468 |
+375 |
0 |
235 |
|
West Virginia |
1,787,147 |
2 |
|
137 |
+129 |
1 |
539 |
|
Maine |
1,344,212 |
43 |
|
1,713 |
+1,627 |
0 |
312 |
|
Montana |
1,068,778 |
10 |
|
509 |
+474 |
0 |
152 |
|
Alaska |
731,545 |
6 |
|
412 |
+352 |
0 |
68 |
|
Total (3-16) |
|
8,131 |
|
82,571 |
|
132 |
Over 80k. Above totals may be less. |
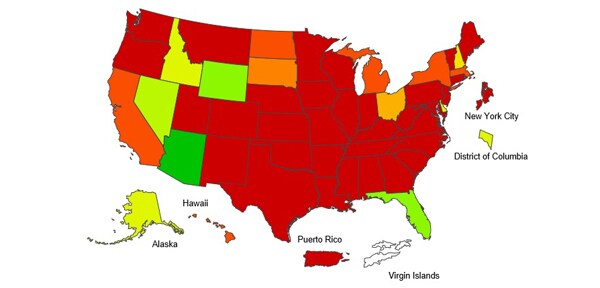
• As for the 2019-2020 Flu season:
The overall cumulative hospitalization rate was 61.6 per 100,000 population which is higher than all recent seasons at this time of year except for the 2017-18 season. Rates in children 0-4 years old and adults 18-49 years old are now the highest CDC has on record for these age groups, surpassing the rate reported during the 2009 H1N1 pandemic. Hospitalization rates for school-aged children are higher than any recent regular season but lower than rates during the pandemic.
|
2019-2020 Season |
|
|---|---|
|
Overall |
61.6 |
|
0-4 years |
88.9 |
|
5-17 years |
22.6 |
|
18-49 years |
32.8 |
|
50-64 years |
80.8 |
|
65+ years |
159.4 |
• Among 2,867 hospitalized adults with information on underlying medical conditions, 92.3% had at least one reported underlying medical condition, the most commonly reported were cardiovascular disease, metabolic disorder, obesity, and chronic lung disease. Among 472 hospitalized children with information on underlying medical conditions, 48.3% had at least one underlying medical condition; the most commonly reported was asthma. Among 477 hospitalized women of childbearing age (15-44 years) with information on pregnancy status, 27.5% were pregnant. (https://www.cdc.gov/flu/weekly/index.htm#ILIActivityMap)(Retrieved 3-17-20)
• Outpatient Illness: ILINet Visits to health care providers for influenza-like illness (ILI) decreased from 5.5% last week to 5.3% this week. All regions remain above their baselines.
• Hospitalizations: The overall cumulative hospitalization rate for the season increased to 61.6 per 100,000.
• P&I Mortality: The percentage of deaths attributed to pneumonia and influenza is 7.1%, below the epidemic threshold of 7.3%.
• Pediatric Deaths: 8 [more] influenza-associated pediatric deaths occurring during the 2019-2020 season were reported this week. The total for the season is 144. - https://www.cdc.gov/flu/weekly/index.htm (Retrieved 3-17-20)
I am so screwed.
Good point. No one cares about killing babies. Wow....
Ping for plague
Nice analysis. While I understand the need to take this seriously, nothing about thus justifies the wholesale hysteria and economic destruction being wrought by our various government’s actions, not to mention the abridgment of our freedoms. It’s insane.
My inlaws shared a meme on FB.
If planned parenthood is closed for 2 weeks, many more lives will be saved than will be lost to the virus.
So why do you think they’re doing it?
Is Trump being played?
Sorry but total numbers do not give the full story that is necessary to understand and deal with this pandemic. Population genetics is still the prime factor in determining susceptibility and severity to this disease. It is important to document 1) the race of infected individuals 2) the age 3) underlying medical conditions, habits and medications used by those who become symptomatic, seriously ill or die. Both the CDC and the WHO have such data but have been studiously refusing to completely release it. Why?
Apples and oranges, reporting known data against the unknown. They’ve only been testing for a few days and are not yet testing in many locations including mine. Where my GD lives they test 5 a day.
With a media that says Bloomberg’s campaign spending could have given a million dollars to every American, your analytics and statistics are like Shakespeare aloud to swine.
Why do you think? Do you have a theory?
and what is the news from Guam?
mike bloomberg wants to know.
Nice analysis. While I understand the need to take this seriously, nothing about thus justifies the wholesale hysteria and economic destruction being wrought by our various government’s actions, not to mention the abridgment of our freedoms. It’s insane.
It is because of the media - both fake news and social media - hyped so much because of politics that it got the majority of people hysterical.
Someone send this to President Trump
In the field of epidemiology, we do not compare deaths to the total population, but to the number of people infected with the disease. We also do not hypothesize about numbers of people who may have been infected but showed no symptoms.
On the basis of actual infections, the latest numbers are 222642 cases, 9115 deaths, and 84506 recovered. This comes out to 4.1% death rate and 38.0% recovery rate. The number of people still infected and the long lag time to death of 2-6 weeks means that the death rate can continue to go up.
Symptomatic rabies is 100% fatal, but we do not say that it isn’t worrisome just because only 1 or 2 people die per year in the US from rabies. We actually have a robust rabies management program because of its deadliness.
In the same vein, we cannot afford to discount the Covid-19 virus just because so few people as a proportion of the population have been affected. Governments are taking drastic measures now because this thing is as communicable as the common cold (it is, in fact, a deadly cold). If we do nothing, millions will die.
What is the colored map at the bottom showing?
I have been ostracized by people who had been longtime friends for saying the same thing.
Don’t forget there are people “investing”, and invested, in the destruction of America.
Couple typos in 4th paragraph you might want to correct.
Alphabetical order would’ve been nice...
Disclaimer: Opinions posted on Free Republic are those of the individual posters and do not necessarily represent the opinion of Free Republic or its management. All materials posted herein are protected by copyright law and the exemption for fair use of copyrighted works.