Good stuff.
Thanks for posting!
Table with data for each state. 11 states were won by less
than 5% of the total vote.
http://uselectionatlas.org/RESULTS/data.php?year=2016&datatype=national&def=1&f=0&off=0&elect=0
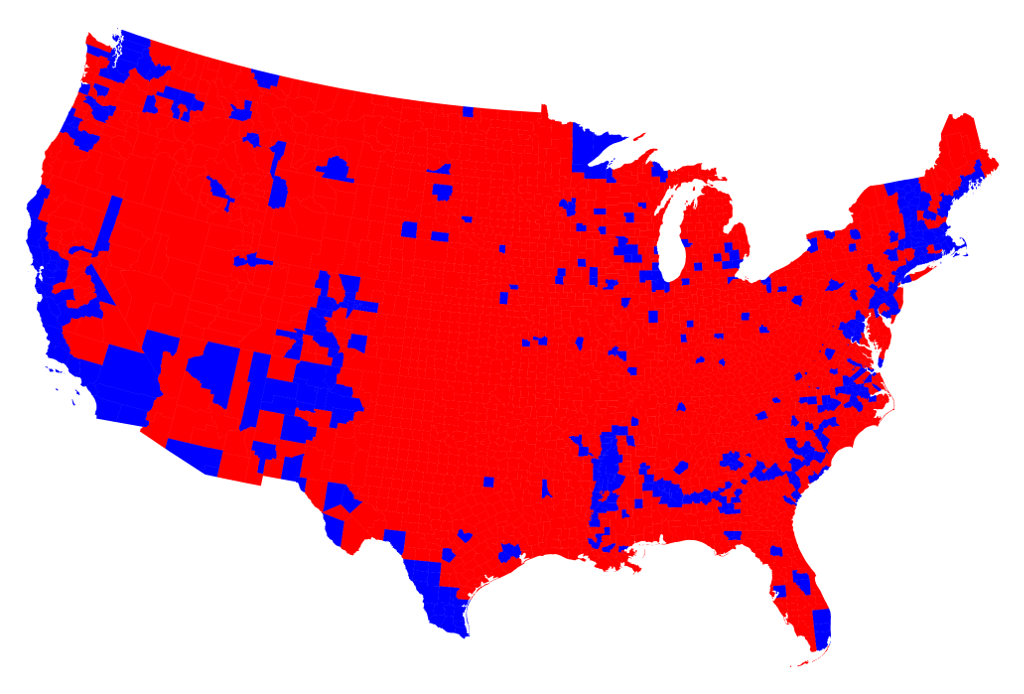
Does anyone know why Michigan is still blank and not red?
Great graphics to reveal just how heavily impregnated the willfully ignorant are into our nation.
Where is the “vote by US citizenship” map?
I would wager the blue areas would be much smaller.
Great graphics; thanks for posting this!
interesting stuff
This merely reinforces my awe for the founders. They devised a system to protect those who do not live in populous states or large cities from the tyranny of democracy
Thanks to this table I deduced:
The 11 battleground states, even though Clinton won CO, NV and NH; she lost by 818K votes, or 49% to 51%.
These 11 states were the contest; not CA, IL, NY or TX.
It seems like the ‘county’ of Windham, Connecticut (really no counties in Connecticut) went Trump.
Would love to see the outcome by Congressional District. Each Elector in the Electoral Congress represents 700,000 people, plus one for each Senator.
This map would reflect the true will of the American People, since each House Member also represents those same people in Congress, it would be nice if they were required to vote for the Presidential Candidate their district chose in the General Election. Hillary would still lose, but vote fraud and massive turnouts in urban areas would be negated.