Posted on 01/27/2013 6:14:57 AM PST by Kaslin
Where do you fit in the 2012 ranking of total money income by age group in the United States?
While we've previously built a tool where you can find out your percentile ranking among all individuals, men, women, families and households in the U.S., we thought it might be fun to break the data for individuals down a little differently - by age group!
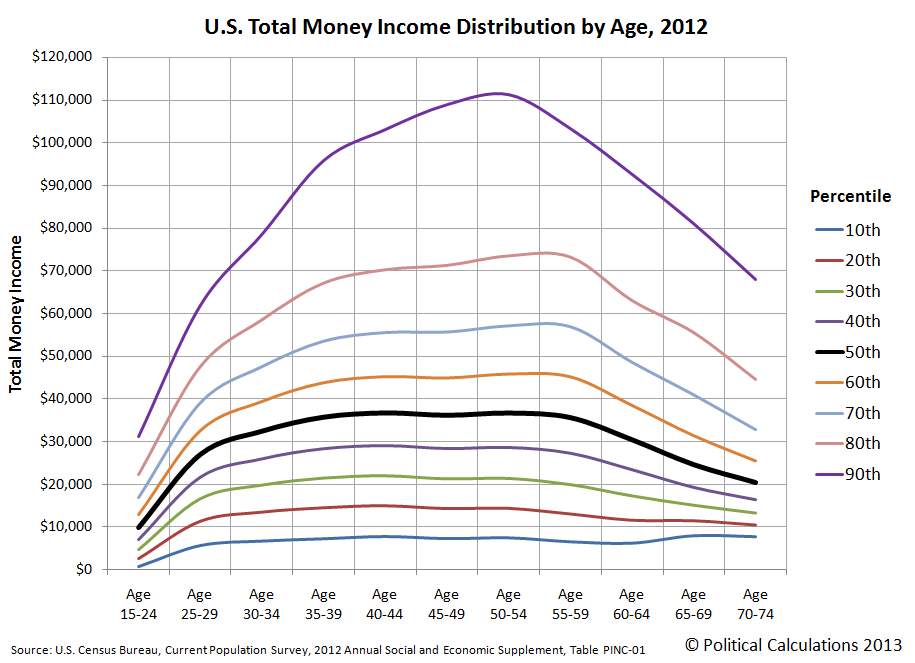
Our chart below reveals what that distribution looked like for 2012, as indicated by the curves showing the major income percentiles from the 10th through the 90th percentile for each indicated age group on the horizontal axis.
The data in the chart represents the income distribution for the estimated 194,271,175 Americans from Age 15 through Age 74. As such, the space between each of the percentile curves on the chart then covers the total money income of some 19.4 million individual Americans.
What stands out most in the chart are the changes in the vertical spread between the 10th, 50th and 90th percentiles by age group, which might be taken as a measure of the relative income inequality for each age group. For example, we see the Age 15-24 group seems to have the greatest income equality, with the least amount of vertical separation between each of the income percentile thresholds.
We said "seems" for the Age 15-24 group, because believe it or not, this group has the highest income inequality of any age group as measured by the Gini index. The reason why has to do with the high concentration of very low income-earning individuals within this age range (for example, about 50% of all minimum wage earners are found in this age group!), against which a relative handful of very talented young people, including entertainers and star athletes, go straight from their school years to multi-million dollar incomes, often before many of these individuals see their careers flameout before they even make it into the next age group. The same phenomenon isn't true for the older age groups, who all tend to gain in income as they gain greater experience, as their Gini index values do follow the pattern we observe in the chart above.
Speaking of which, one thing that's pretty clear in the chart is that incomes at each major percentile threshold increase across the board as individuals accumulate work experience up through the Age 40-44 group. Above that point, that's would seem to only be true for above-median income-earning individuals.
Going back to the overall patterns we observe in this income distribution visualization, we see that the greatest vertical spread between the 10th and 90th percentiles occurs for the Age 50-54 group, which corresponds to the peak earning years for Americans.
But that vertical spread indicating income inequality diminishes rapidly for older age groups, which is consistent with the transition from earning wages and salaries to only having retirement income. It's especially interesting to see that the peak the retirement-associated decline occurs earlier for the 90th percentile income-earners, while it occurs around Age 55-59 for the lower income-earning percentiles.
The vertical spread between the 10th and 50th percentiles are interesting as well. Here, see see that after rising rapidly for the young, the 50th percentile income level begins to plateau for those around Age 35-39, then holds fairly level through Age 55-59, after which it declines as older individuals increasingly leave wage and salary-earning jobs they've had for years for retirement.
We'll revisit this chart in an upcoming post, where we'll conduct something of a thought experiment....
We took the age-based total money income data presented by the U.S. Census to construct cumulative income distributions for each included age group, then used ZunZun's curve-fitting tools to develop mathematical models for each to calculate the income that goes with a particular income percentile. The indicated incomes in the chart above are typically within a few hundred dollars of the IRS' published data.
As another hint to what's coming soon here at Political Calculations, those mathematical models just might show up in the future as a new tool that you can use to see exactly what your income percentile ranking is within your own age group!
U.S. Census Bureau. Current Population Survey. 2012 Annual Social and Economic Supplement. Table PINC-01. Selected Characteristics of People 15 Years Old and Over by Total Money Income in 2011, Work Experience in 2011, Race, Hispanic Origin, and Sex. [Excel Spreadsheet]. 12 September 2012.
The downward elbow in the 50 to 60 age range isn’t because employers lower salaries on older workers to match output. They terminate them, which leads to an unfortunate loss of institutional knowledge. It’s too bad there’s not a better way to handle the pay to output discrepancy of the wiser workers.
I do realize that that may very will be part of it, but I think that, given the way that they acquired the data in the population it covers, that downward trend is likely a large part of the natural process of people leaving the workforce as they retire, with a commensurate downturn in income.
I recognize that there are lots of places that do trim older workers from their workforce, and as a result of the shortsighted philosophy, they lose valuable workers who have valuable experience.
“Hittin’ it” ain’t the same as “marryin’ it”!
;^)
MIne are all in the back.
Heheheheh...:)
Where are the TRUCKS?


For obvious reasons, I’m not marrying him. *SMIRK*
Disclaimer: Opinions posted on Free Republic are those of the individual posters and do not necessarily represent the opinion of Free Republic or its management. All materials posted herein are protected by copyright law and the exemption for fair use of copyrighted works.