Posted on 01/02/2010 9:11:23 PM PST by Steelfish
Obama Approval Index Month-by-Month Saturday, January 02, 2010
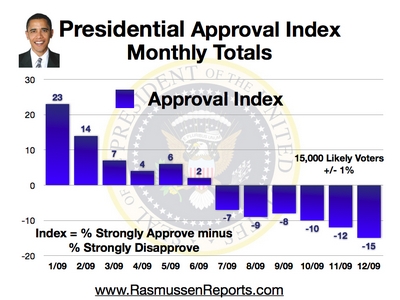
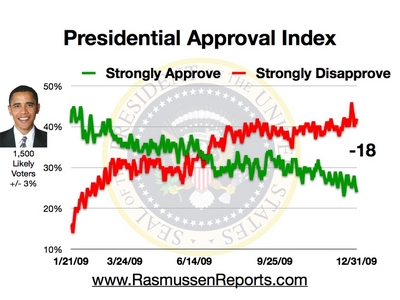
When tracking President Obama’s job approval on a daily basis, people sometimes get so caught up in the day-to-day fluctuations that they miss the bigger picture. To look at the longer-term trends, Rasmussen Reports compiles the numbers on a full-month basis, and the results can be seen in the graphics below.
The president’s Approval Index ratings fell three points in December following two-point declines in both October and November. Looking back, the president’s honeymoon ended quickly before his ratings stabilized from March through May. They tumbled in June and July as the health care debate began before stabilizing again over the summer. Public attitudes towards the health care legislation have hardened in recent months, with most voters opposed to the work being done in Congress.
As Congress has drawn closer to achieving the president’s goals on health care, unemployment also has been rising, and Obama’s ratings have reflected the turmoil.
The number who Strongly Disapprove of the president’s performance inched up a point to 41% in December. The number who Strongly Approved fell two more points to 26%. That leads to a Presidential Approval Index rating of -15, a new low for Obama.
Also in December, the president’s total approval dropped two points to 46%. His total disapproval gained a point to 53%. It’s worth noting that the Approval Index ratings have generally proven to be a good leading indicator of the president’s overall approval ratings.
(Excerpt) Read more at rasmussenreports.com ...
Wasnt’ he at minus 20 already once?

Nice graphic. Well done!

That is what I was thinking.
Hopefully the muslim will be there again in the coming week.
The -20 was a 3-day average. Perhaps the December -15 is a new low monthly average. I dunno.
3 more years of this sh!t. Sucks to be us.
“Wasnt’ he at minus 20 already once?”
Indeed he was. I recall that it even went to -21% on one occasion. It is not what happens on any one day that is significant. The important component is the trend, and it is generally downwards (this is a good thing for our side).
I would be interested in what the folks here perceive Obama’s popularity rating/polls from the other groups, besides Rasmussen. As you may have noticed, the White House has brought out the long knives with Mr. Rasmussen. IMHO this is exactly like killing the messenger.
Do most polling organizations find a similar statistical slide in Obama’s ratings? If this happens to be the case, then trying to take out one polling organization is not going to be terribly effective, if the general flow is against the Executive.
Does anyone care to offer their opinion on how the rest of the polling crowd is portraying O’s numbers?
Do you know if it’s okay to post Rasmussen charts on a Facebook account? I want to play with some liberals!!!
Obviously an isolated incident, no trend here ;-)
98% approval amoung people with matching skin color, that’s how.
I’ve heard some people make light of the approval index since it only considers strong feelings of approval/disapproval and not overall approval.
But strong feelings are EXACTLY what counts come election time. In elections, the demoralized tend to lose to the energized.
Mere approval isn’t enough to get people to the polls.
If the index remains strongly negative, you can bet the Democrats lose big in 2010.
The big election is 2012, of course. There are so many Dem Senate seats up for grabs.
Rassumssen polls are RACIST! /rahm emanuel
The 60 day average stands at about -12 while his day to day numbers are in the -14 to -20 range indicating that the downward trend will continue. That would always be indicated if the day to day numbers are more negative than the 60 day average. If he starts polling better than the 60 day average then he will be in an upswing. If you look at the plot carefully you will see that there are periods of pretty constant ratings and periods of falling ratings and virtually no periods of improvement in Obama's rating. I find that somewhat surprising but, of course, a good thing.
...

It probably is. If you're worried you can use my plot from post #17. It uses Rasmussen's data but not specifically his plot.
Going down by the bow faster than the H.M.S. Titanic
 The Patriot's Flag - Blank Screen Politics
Disclaimer: Opinions posted on Free Republic are those of the individual posters and do not necessarily represent the opinion of Free Republic or its management. All materials posted herein are protected by copyright law and the exemption for fair use of copyrighted works.